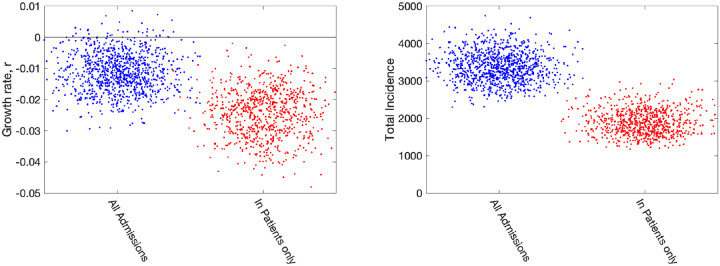
Fig. 7: Impact of including different types of hospital admission in parameter inference.
Growth rates and total incidence (asymptomatic and symptomatic) estimated from the ODE model for June 10th 2020 in London. The panels display posterior predictive distributions for the stated statistic, where each data point corresponds to an estimate produced from a model simulation using a single parameter set sampled from the posterior distribution. To aid visualisation, we have applied a horizontal jitter to the data points. In each panel, blue dots (on the left-hand side) give estimates when using all hospital admissions in the parameter inference (together with deaths, ICU occupancy and serology when available); red dots (on the right-hand side) represent estimates obtained using an alternative inference method that restricted to fitting to in-patient hospital admission data (together with deaths, ICU occupancy and serology when available). Parameters were inferred using data until 9th June 2020, while the growth rate r comes from the predicted rate of change of new infections.

