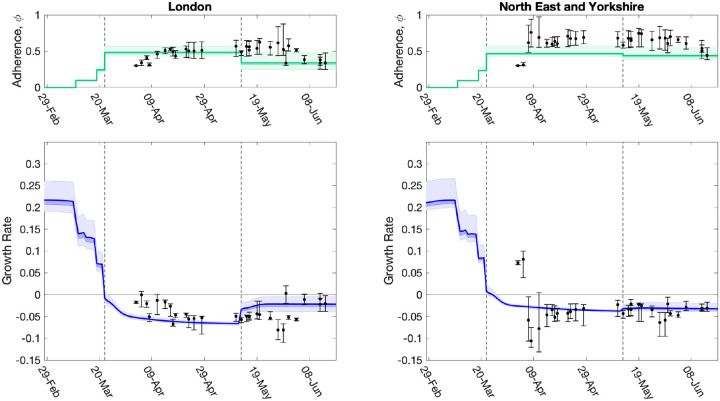
Fig. 8: Evolution of strength of interventions and adherence values (ϕt), and associated growth rate predictions (r) together with later model estimates.
For two regions, (left) London, and (right) North East & Yorkshire, we show estimated values of the strength of interventions (comprising intervention stringency and adherence to measures, ϕt), inferred from the MCMC scheme, which are translated through the model into predictions of r. The dots (and 95% credible intervals) show how these values have evolved over time, and are plotted for the date the MCMC inference is performed. The solid green and blue lines (together with 50% and 95% credible intervals) show our estimate of ϕt and r through time using a fit to the data performed on 14th June 2020 (restricting hospital data to in-patient data only). Vertical dashed lines show the two dates of main changes in policy (imposition of lockdown on 23rd March 2020, easing of restrictions on 13th May 2020), reflected in different regional ϕt values. Early changes in advice, such as social distancing, self isolation and working from home were also included in the model and their impact can be seen as early declines in the estimated growth rate r before 23rd March 2020.

