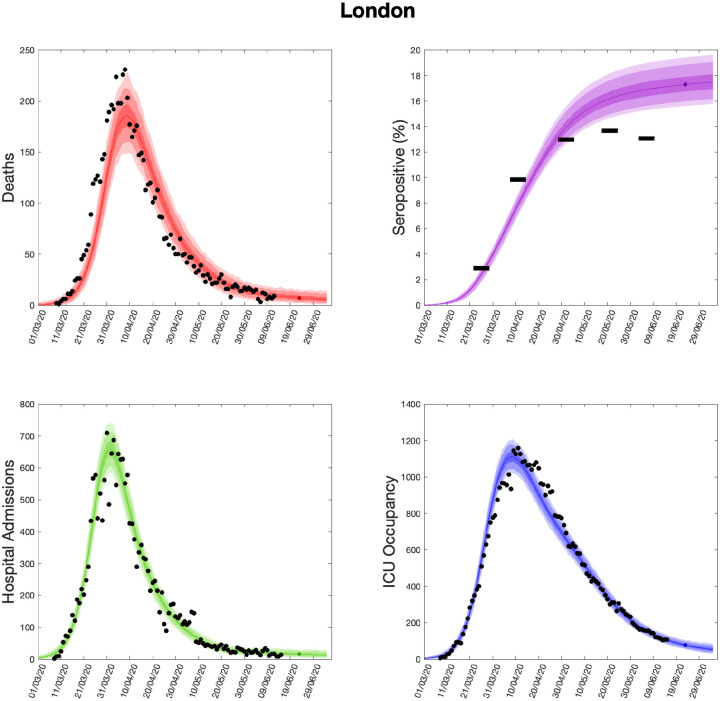
Fig. 9: Health outcome predictions of the SARS-CoV-2 ODE transmission model from the beginning of the outbreak and three weeks into the future for London.
(Top left) Daily deaths; (top right) seropositivity percentage; (bottom left) daily hospital admissions; (bottom right) ICU occupancy. In each panel: filled markers correspond to observed data, solid lines correspond to the mean outbreak over a sample of posterior parameters; shaded regions depict prediction intervals, with darker shading representing a narrower range of uncertainty (dark shading - 50%, moderate shading - 90%, light shading - 99%). The intervals represent our confidence in the fitted ODE model, and do not account for either stochastic dynamics nor the observational distribution about the deterministic predictions - which would generate far wider intervals. Predictions were produced using data up to 14th June 2020.

