Figure 5.
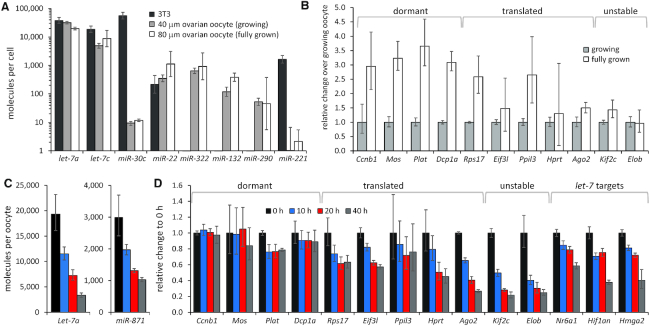
miRNAs do not accumulate during the oocyte growth and have higher turnover than mRNAs. (A) PCR-based quantification of miRNAs in 3T3 fibroblasts (∅ 18 μm), mouse growing oocyte (∅ 40 μm) and fully grown oocyte (∅ 80 μm). miRNA copy numbers per cell were estimated in three independent experiments using the standard curve in Supplementary Figure S1C. Error bars = standard deviation (SD). Logarithmic scale is used for y-axis. 3T3 cell and fully grown oocyte values are the same as in Figure 2A. (B) mRNA abundance in fully grown oocyte (∅ 80 μm) relative to mouse growing oocyte (∅ 40 μm). The mRNA abundance in the growing oocyte is set to one. mRNA abundance was estimated in three independent experiments per oocyte cDNA equivalent. Error bars = standard deviation (SD). (C) qPCR-based quantification of miRNA per oocyte equivalent during extended culture of fully grown oocytes in the presence of IBMX. miRNA abundance was estimated in two independent experiments. Error bars = standard deviation (SD). (D) mRNA abundance in fully grown oocytes during extended culture in the presence of IBMX relative to oocytes collected at 0 h, which is set to one. mRNA abundance was estimated per oocyte equivalent in two independent experiments. Error bars = standard deviation (SD).

