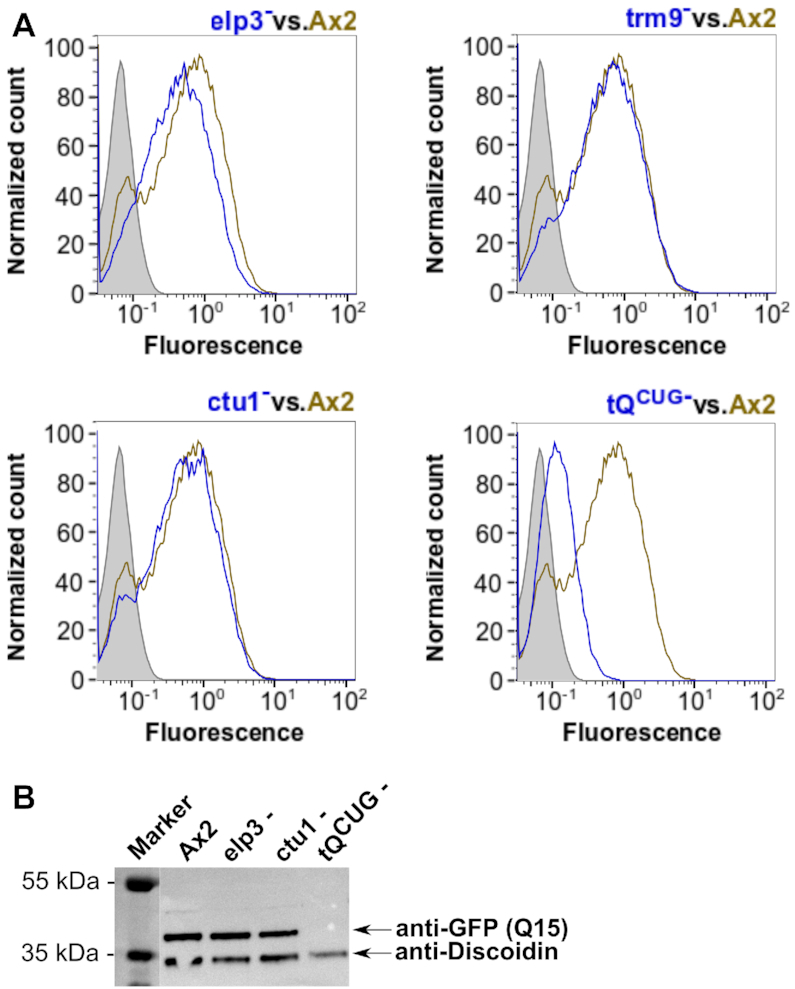
Figure 8.

Expression of GFP with the Q15 leader sequence. (A) Representative flow cytometry detected fluorescence profiles of Q15-GFP in Ax2 wild type compared to elp3−, trm9−, ctu1− and tQCUG− mutant strains. Shown are expression profiles from the mutant strain (blue) vs. Ax2 (olive). Grey areas indicate the background signal from untransformed strains. Fluorescence is shown in arbitrary units. (B) Western blots against GFP with the Q15-leader expressed in the indicated mutant strains, compared to Ax2 wild type. Discoidin antibodies served as loading and transfer controls. M: PageRuler Plus Prestained Protein Ladder as size marker with relevant sizes shown to the left.
