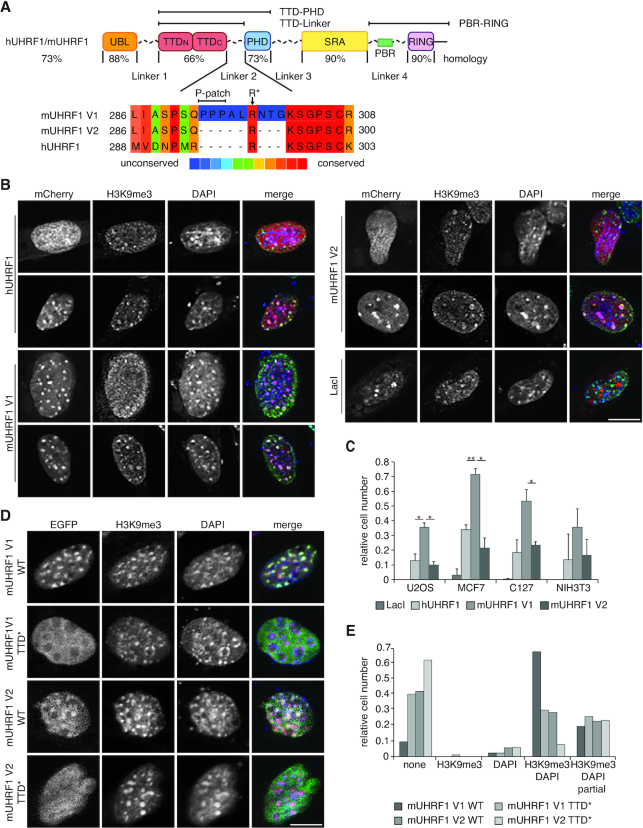
Figure 1.
The subcellular localization of mUHRF1 V1 is different from mUHRF1 V2 and hUHRF1. (A) Scheme illustrating domain structure and sequence conservation of mouse and human UHRF1 (according to ClustalV). UBL, ubiquitin-like domain; TTD, tandem tudor domain (TTDN-TTDC); PHD, plant homeodomain; SRA, SET and RING associated domain; RING, really interesting new gene domain. Multiple sequence alignment (PRALINE alignment tool, http://zeus.few.vu.nl/programs/pralinewww/) of Linker 2 of the different proteins is shown. Amino acid positions correspond to the following NCBI entries: hUHRF1, NP_001276981.1; mUHRF1 V1, NP_001104550.1; mUHRF1 V2, NP_001104548.1. (B) Confocal images of murine C127 cells expressing mCherry-tagged murine and human UHRF1 proteins (mCherry, red channel). Cell populations showed different distribution of UHRF1. Representative cells of diffuse (top row) and focal (bottom row) UHRF1 nuclear distribution are shown. Immunofluorescence staining was performed for H3K9me3 (green channel). DAPI staining marks the DNA (blue channel). Merged images show all three channels simultaneously. Scale bar: 15 μm. (C) Co-localization of H3K9me3 and mCherry-tagged proteins as shown in (B) was assessed visually. Data are presented as mean and standard deviation (s.d.) of three independent experiments (n > 100). Unpaired two-sided student's t-test was performed to compare samples; (*) P < 0.05, (**) P < 0.01. (D) Representative confocal images of murine NIH-3T3 cells expressing EGFP-mUHRF1 V1 and V2 WT and Y184/Y187A (TTD*) mutant proteins (EGFP, green channel). Immunofluorescence staining was performed for H3K9me3 (red channel). DAPI staining marks the DNA (blue channel). Merged images show all three channels simultaneously. Scale bar: 10 μm. (E) Co-localization of EGFP-tagged proteins as shown in (D) with H3K9me3 and DAPI-dense regions was assessed visually and is plotted relative to the total number of EGFP-positive cells (n > 70).

