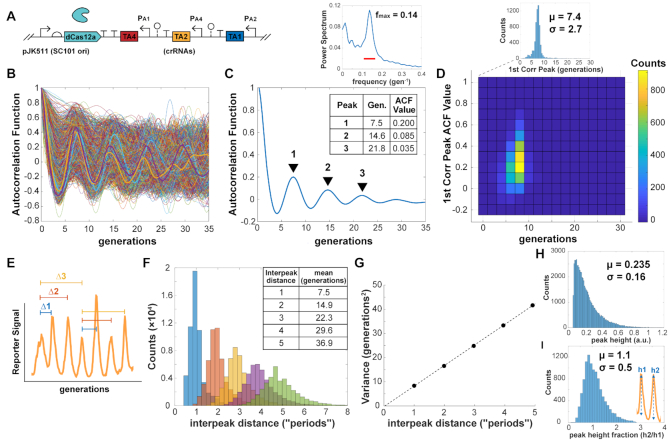
Figure 5.
dCas12a RNA oscillator ACF and interpeak distance. (A) The 1-plasmid dCas12a oscillator circuit with (B) ACF calculated for 6335 individual cell traces. Selected representative traces are bolded. (C) The population-averaged ACF showed clear correlation peaks, with the first correlation peak of ∼7.5 generations. The power spectrum of the ACF shows a max frequency around 0.14, or 7.1 generations. The bar indicates the width of the window function. (D) Individual cell trace first correlation peaks were mostly clustered around the same period length, with some individual trace ACF peaks showing higher values. (E) Interpeak distance was calculated for peaks of oscillatory traces, where ACF first minimum and first correlation peaks exceeded values ±0.05. (F) Calculated interpeak distances showed distinct distributions following multiples of the first. These are labeled as ‘periods’, multiples of the 1-interpeak distance. (G) Variances of the interpeak distances increase linearly with period distance. (H) Distribution of estimated peak heights for peaks of oscillatory traces, where ACF first minimum and correlation peaks exceeded ±0.05. (I) Peak height fractions for consecutive peaks, comparing one peak with its preceding one.

