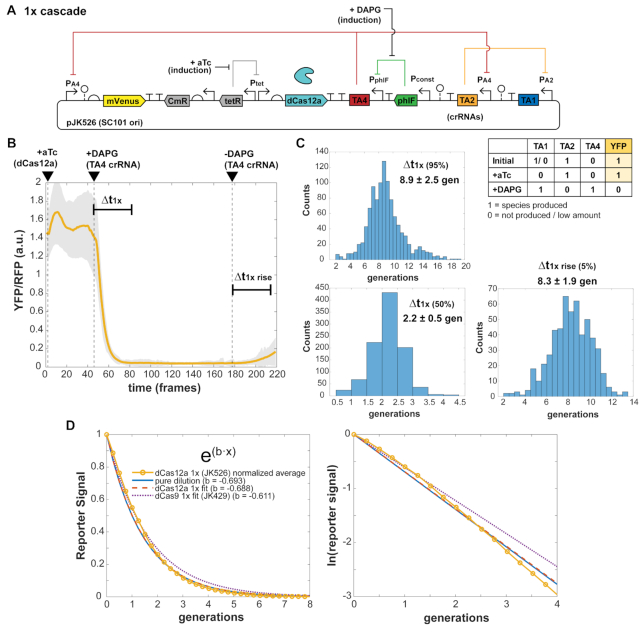
Figure 6.
dCas12a crRNA repression response times. (A) A single constitutive promoter of the free-running dCas12a oscillator was replaced with a PhlF repressor-based promoter system, allowing inducible control with small molecule DAPG and measurement of characteristic times Δt of crRNA repression cascade steps. Escherichia coli MG1655 cells with plasmids were grown in EZ-RDM in the mother machine. (B) One-step crRNA repression is measured. Expected behavior is YFP bright to dim upon DAPG induction (TA4 crRNA). Averaged trace from 1049 cells of plasmid version (pJK526), with shaded region showing one standard deviation of the averaged values. 1 frame = 6 min. (C) Histograms of measured characteristic time steps indicated in (B) for single cell traces. Percentages are percent repression or de-repression. Distributions measured from 1045 cells. (D) Exponential fitting of the averaged trace (JK526) and dCas9 1× cascade trace. The ‘pure dilution’ curve (solid line) corresponds to that expected for dilution from cell division alone.

