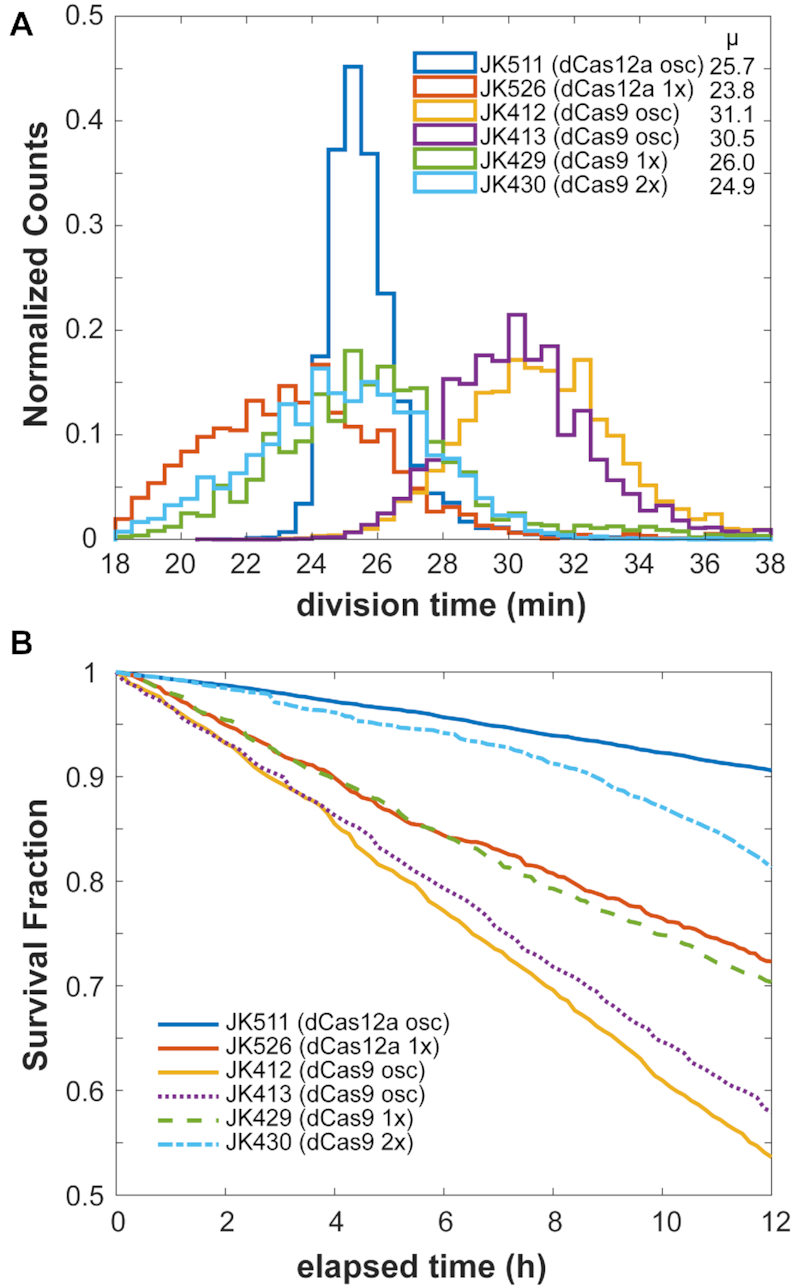
Figure 7.

Cell growth comparisons. Estimates on growth efficiency of RNA oscillator and cascade strains. Cell division times depended on media and chip conditions. (A) Average growth division times, as observed in mother machine runs. Each count is a single mother cell's average division time over the course of the run. Cell counts: JK511, 7998; JK526, 2263; JK412, 7158; JK413, 7396; JK429, 5921; JK430, 7779. (B) ‘Survival’ curves of mother cells, estimated in a 12-h window within the first 24 h of imaging. The fraction of mother cell trajectories remaining after the indicated time estimates cell survival.
