
Figure 1.
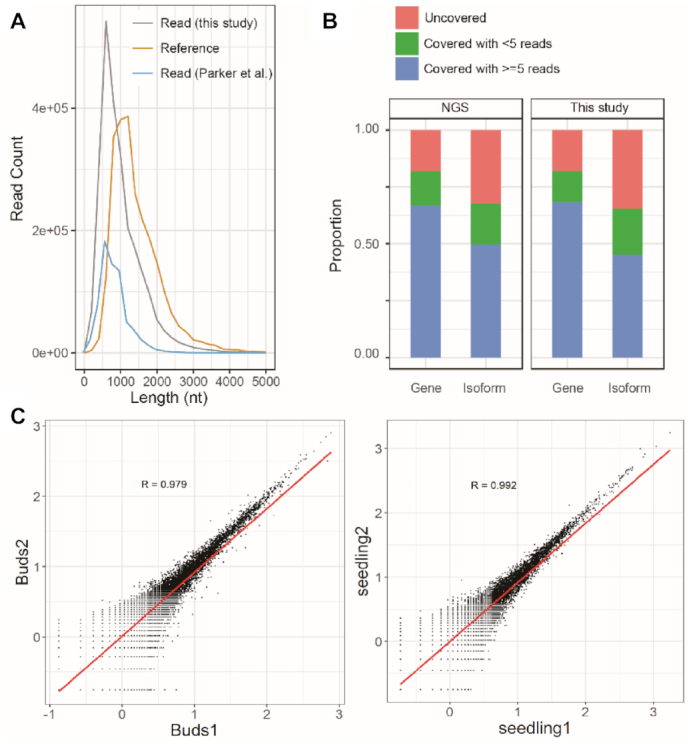
Statistical analysis of Nanopore reads and coverage as well as replicate reproducibility. (A) Read length distribution. Grey curve: the length distributions of Nanopore read; yellow curve: reference according to the existing longest isoforms of the gene were counted; blue curve: the length distributions of Nanopore reads from two of the seedling samples with 5′ adaptor from the publication of Parker et al. (4). (B) The proportion of the existing isoforms or genes in the Araport11 reference covered by all our long reads (right) or by the same amount of NGS reads (left). Red: not discovered genes or isoforms; green: genes or isoforms discovered by Nanopore read, but with <5 reads support; blue: discovered genes or isoforms with >5 reads support. (C) Correlation between two replicates of sequenced libraries. Shown are the biological replicates from floral buds (left) and seedlings (right).