
Figure 6.
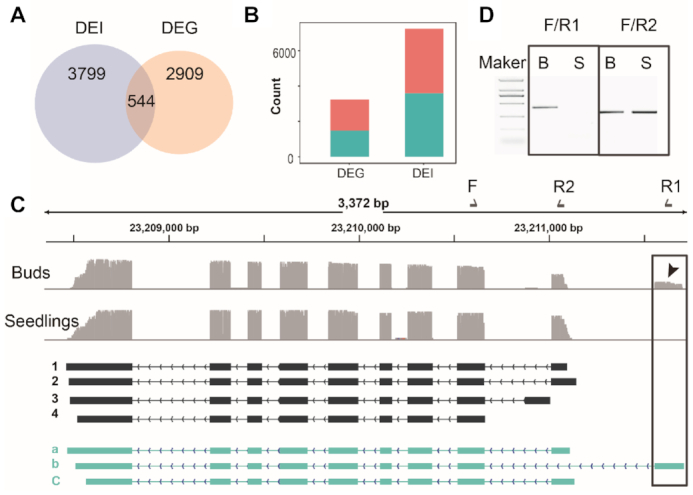
DEG and DEI between seedlings and floral buds. (A) Venn diagram showing the intersection of DEI and DEG, (B) counts of the up- and down- regulated DEG and DEI in seedling compared with floral bud, (C) an example of IGV track showing floral bud-specific ATI in the gene At5g57300, (D) experimental confirmed floral bud specific ATI events. The existing and novel isoforms are depicted in black (1–4) and green (a–c) respectively. A previously undefined ATI that is bud-specific is highlighted by a box. The primers used to validate these isoforms are labelled in the diagram. F, forward primer; R1, reverse primer 1; R2, reverse primer 2.