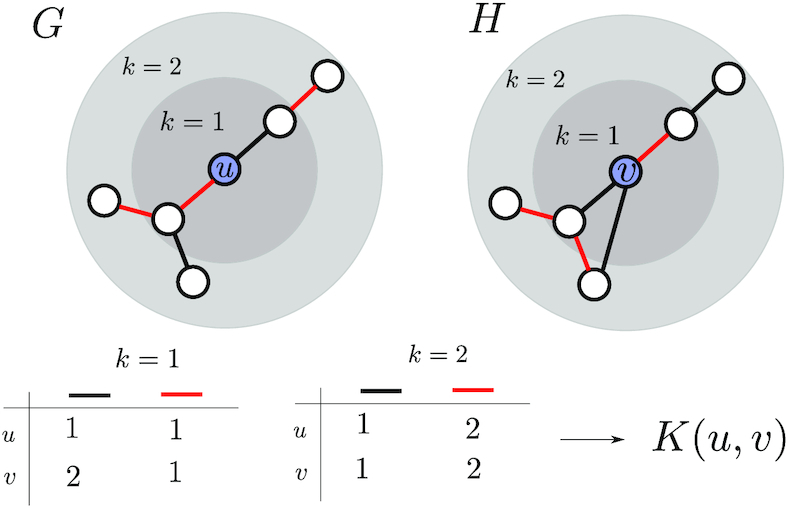
Figure 3.

Here, we compare the local neighbourhoods of node u in graph G and node  in graph H. In this simple example, graphs only have one of two possible edge types, red and black. We compare the distributions of edge labels at each distance from the source nodes (u and
  ) to obtain the final similarity value K(u,
  ).
).
