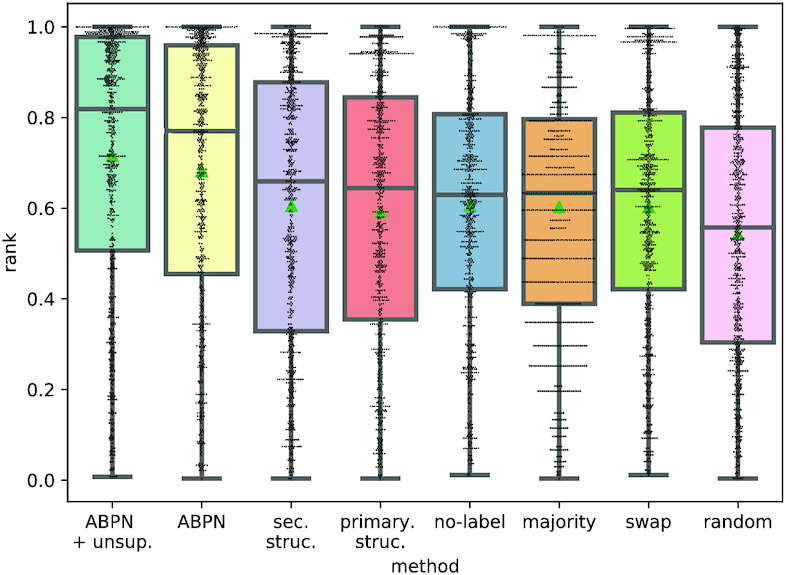
Figure 4.

Distribution of rank achieved on ligand screening. All points are from test set data on a 10-fold cross validation. The median is denoted with a dashed line and the mean with a green triangle. Each point is the normalized rank of one binding site’s native ligand when searching for it using our network’s predicted fingerprint.
