Figure 3.
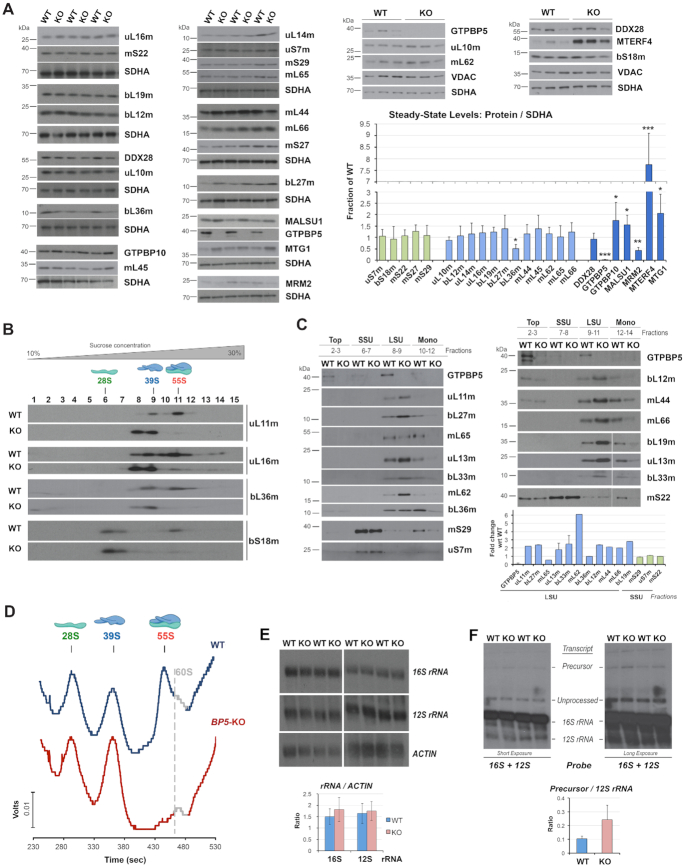
GTPBP5 is essential for the formation of monosomes. (A) Immunoblot analysis of the steady‐state levels of mitoribosome proteins and assembly factors in mitochondria isolated from HEK293T (WT) and GTPBP5-KO (KO) cells. SDHA or VDAC were used as loading controls. The right panel shows the densitometry values normalized by the signal of SDHA and expressed relative to the WT. Data represent the mean ± SD of at least three WT and GTPBP5-KO samples; t-test: *P < 0.05, **P < 0.01, ***P < 0.001, ****P < 0.0001. (B) Sucrose gradient sedimentation analyses of mitoribosome mtSSU (bS18m) and mtLSU (uL11m, uL16m and bL36m) markers in mitochondria prepared from HEK293T (WT) or GTPBP5-KO (KO) cells. (C) Immunoblot analysis of MRP levels in the sucrose gradients fractions presented in panel (B) in which the monosome, mtLSU, mtSSU, and unassembled subunits (top) peak. Equal volumes of fractions corresponding to each cell line were loaded. The lower panel shows the densitometry values of the proteins in either the mtLSU or mtSSU fraction and expressed as fold change relative to the WT. Data represent only one set of each protein and the mean and range of two sets of GTPBP5, uL13m and bL33m. (D) Continuous RNA profile (absorbance at 254 nm) obtained during the collection of the gradient fractions presented in panel (B), using a Brandel fractionation system and Brandel Peak Chart Software. The fractions where the 28S mtSSU, 39S mtLSU, and 55S monosome sediment are indicated. The presence of traces of contaminating 60S cytoplasmic ribosomes is marked in grey. (E, F) Northern blot analyses of the steady-state levels of mitochondrial rRNAs in WT or the GTPBP5-KO cells. Multiple experimental repetitions and X-ray film exposures are presented to display the steady-state levels of 12S-16S precursor transcript, 12S, and 16S unprocessed and fully processed transcripts. The lower panels show the densitometry values normalized by the signal of ACTIN mRNA or the 12S rRNA. Data represent the mean ± SD of three independent repetitions.

