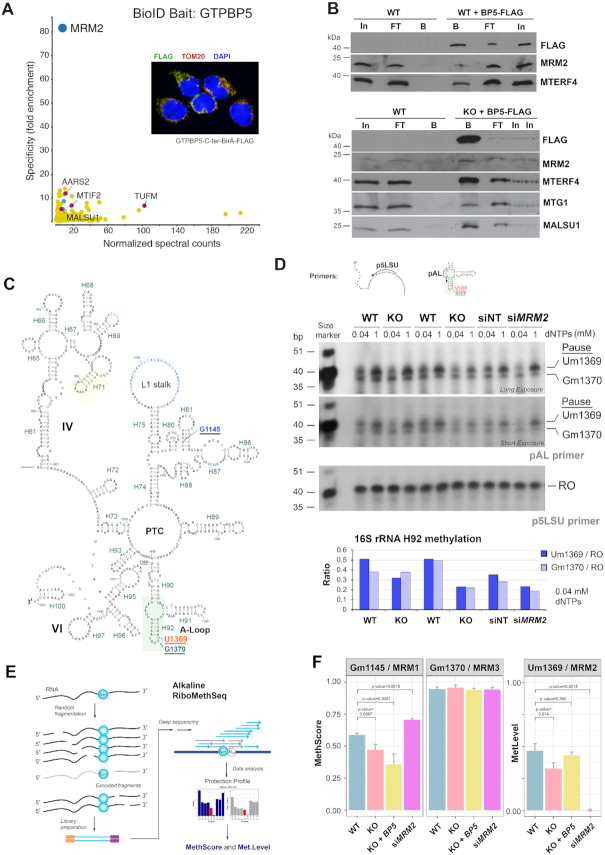
Figure 6.
GTPBP5 interacts physically and functionally with the 16S rRNA methyltransferase MRM2. (A) Prey specificity graph for BioID proximity interactome of GTPBP5 protein, where the prey specificity was determined as the relative enrichment of interaction of individual preys and GTPBP5, compared to their interaction with 100 other mitochondrial baits. The most significant prey is highlighted in dark blue. Enriched mitochondrial ribosome assembly and translation factors are highlighted in red, and enriched ribosomal proteins of the mtLSU are depicted in light blue. The inset represents an immunofluorescence labeling of cells that express the fusion protein using antibodies against FLAG and TOM20 (mitochondrial marker), and DAPI staining of the nucleus. (B) Co-immunoprecipitation analysis of GTPBP5-FLAG and the highly ranked GTPBP5 BioID hits as well as additional native interacting mtLSU assembly factors with Flag Tag (D6W5B) Rabbit mAb-conjugated sepharose beads. Mitochondrial extracts prepared from WT cells not expressing GTPBP5-FLAG were used as control. Two independent experiments are presented. In, input. FT, flow-through or unbound. B is bound. (C) Diagram of the secondary structure of a portion of the human mitochondrial 16S rRNA deduced directly from the reported cryo-EM structure (41). Unbuilt regions are marked in blue lettering, rRNA in Roman numerals, helices and nucleotide numbering in green, modified residues in the A-loop are underlined, and Um1369 is marked in red. (D) Primer extension to measure levels of the A-loop methyl modifications of human mitochondrial 16S rRNA residues at U1369 and G1370, using the primers pAL that detect the modifications, or p5LSU that is used to standardize the loading of 16S rRNA as previously reported (42). Total RNA preparations from HEK293T (WT) or GTPBP5-KO (KO) cells were used in the assay. RNA samples from WT cells treated for 3 days with non-targeting siRNA (siNT) or siMRM2 were used as controls. Radiotracer-labeled primers were added separately in an RT- primer extension reaction using two concentrations of dNTPs as indicated. Reaction products were separated on a 12% denaturing urea-polyacrylamide gel and subjected to autoradiography. Images after two exposure times are presented. The specific pausing sites upon extension of the pAL primer at nucleotide positions Um1369 and Gm1370 are marked. RO is the runoff product resulting from extending the p5LSU primer. In the bottom graphs, Um1369 and Gm1370 signals were quantified by densitometric integration of the lines using the histogram panel of Adobe Photoshop, normalized by the signal of RO signal and plotted. (E) General overview of the Illumina-based RiboMethSeq method for mapping of 2′-O-Me residues in RNA that was implemented to analyze the samples as reported (32). In this approach, alkaline fragmentation of RNA excludes RNA fragments ending with 2′-O-Me and, subsequently, also starting with N + 1 orN + 2 nucleotide. After conversion to the sequencing library these fragments become underrepresented (grey arrows). When sequencing reads are mapped to the reference sequence, 5′-end and 3′-end coverage show a characteristic drop, resulting from protection (see Supplemental Figure S5). These profiles are subsequently merged (with –1 nt or –2 nt backshift for the 5′-end coverage) to obtain a cumulated profile used for calculation of RiboMethSeq scores (43). (F) RiboMethSeq analysis results showing the methylation scores at the sites G1145, U1369, G1370 for WT, GTPBP5-KO, GTPBP5-KO reconstituted with GTPBP5 and silencing of MRM2 (siMRM2). For U1369, we used siMRM2 as unmodified reference to normalize the data and calculate methylation levels. The error bar represents +/- SD values from three replicates of WT, GTPBP5-KO overexpressing GTPBP5, and siMRM2, and four replicates of GTPBP5-KO. The P-values are calculated by t-test (two-tailed/equal variance): *P < 0.05; **P < 0.01, ***P < 0.001.

