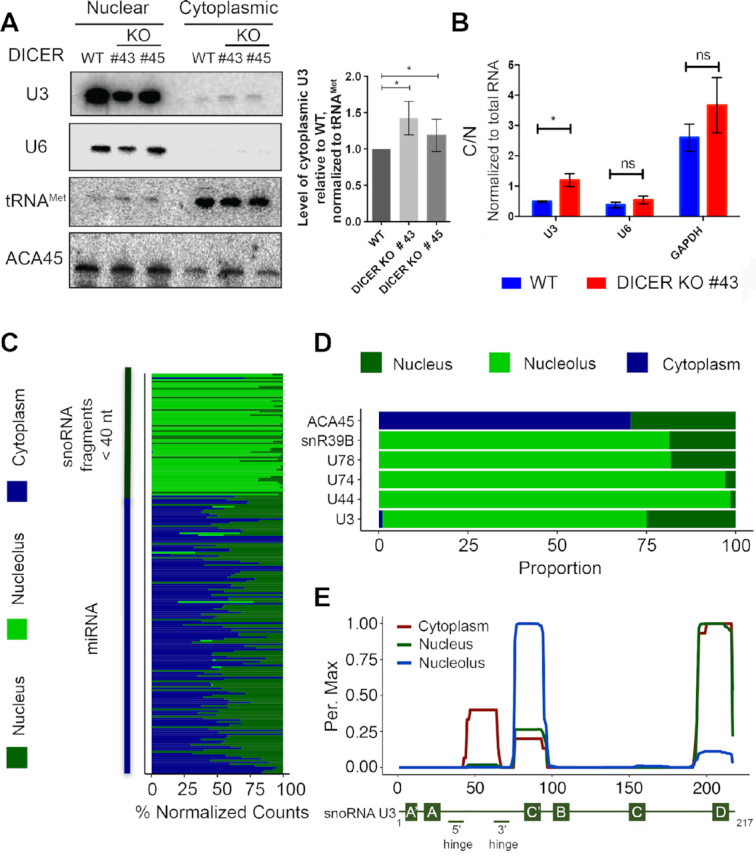
Figure 5.

A portion of the U3 snoRNA is exported to the cytoplasm where it is processed to form miRNAs. (A) Wild-type HCT116 cells (WT) or HCT116 cells lacking Dicer (KO #43 and #45) were fractionated into nucleoplasm and cytoplasm, and total RNA was extracted. RNAs were separated by denaturing polyacrylamide gel electrophoresis and transferred to a nylon membrane. Northern blotting was performed using radiolabelled probes against the indicated RNAs. The levels of cytoplasmic U3 in the knockout cells lines relative to the wild type, normalised to tRNAMet, were determined in three independent experiments and data are shown as mean ± standard error. Significance was calculated using the one sample t-test; *P < 0.05. (B) Total RNA prepared from cells as in (A) was reverse transcribed and quantitative PCR was performed to monitor the levels of the U3 snoRNA, the U6 snRNAs and the GAPDH mRNA. The relative amounts of each RNA in cytoplasm and nucleus was calculated. * indicates P < 0.05, ns indicates non-significant (two sample t-test). (C) The relative proportions of reads mapping to sno/scRNAs and miRNAs in small RNA-seq data from HeLa cell nucleoli, nuclei and cytoplasm is shown. (D) Selected examples of the data presented in (C) are shown. (E) The normalised number of reads mapping to each nucleotide of the U3 sequence in the datasets described in (C) is shown as a percentage of the maximum (Per. Max) above a schematic model of the U3 snoRNA.
