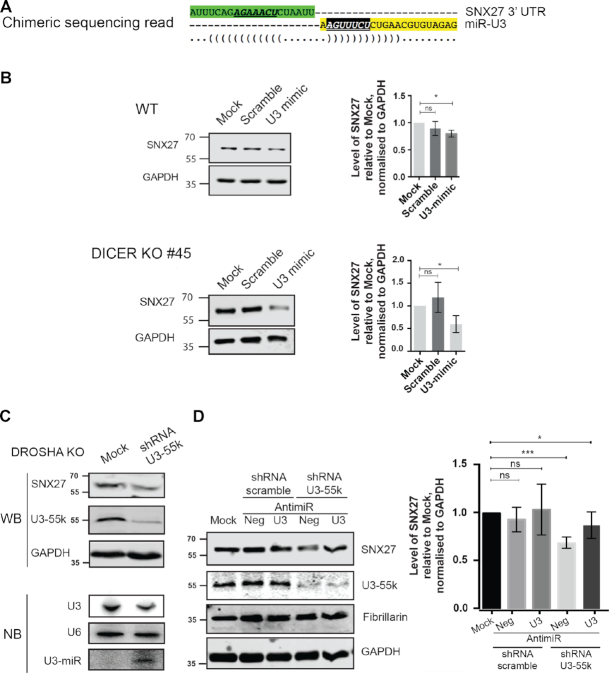
Figure 6.
The U3-derived miRNA targets the SNX27 mRNA. (A) Schematic representation of the chimeric sequence reads containing sequence of the SNX27 mRNA (upper, green) and the U3-derived miRNA-like fragment (lower, yellow) identified in CLASH analysis of AGO1. The seed sequence of the U3-derived miRNA-like fragment is shown in white, italics and underlined, and the target site (mRNA) is shown in bold, italics and underlined. ‘(‘ and ‘)’ indicate nucleotides that can form basepairing interactions. (B) Wild-type HCT116 cells (WT) and DICER KO cells were mock transfected (Mock) or transfected with a siRNA mimic of the U3-derived miRNA (U3 mimic) or a scrambled sequence (Scramble). The levels of SNX27 and GAPDH proteins were determined by western blotting and the amount of SNX27 in the transfected cells compared to the mock, normalised according to the GAPDH loading control is shown as a bar graph. Data from three biological and two technical replicates is shown as mean ± standard error. Significance was calculated using the one sample t-test; ns – not significant, *P < 0.05. (C) HCT116 cell lacking Drosha (DROSHA KO) were transfected with plasmids for expression of a short-hairpin RNA (shRNA) targeting U3–55K or mock transfected (Mock). Protein levels were determined by western blotting using the indicated antibodies (upper panels). Total RNA was extracted and small RNAs (<200 nt) were enriched. Total and small RNAs were separated by denaturing polyacrylamide gel electrophoresis and transferred to nylon membranes where they were detected by northern blotting using probes against the U3 and U6 snRNAs (total RNA) and the U3-derived miRNA (small RNAs). (D) HCT116 cell lacking Drosha (DROSHA KO) were mock transfected (Mock) or transfected with plasmids for expression of a short-hairpin RNA (shRNA) targeting U3–55K or a scrambled sequence and were co-transfected with a miR-U3 anti-miR (U3) or control anti-miR (neg). Protein levels were determined by western blotting using the indicated antibodies (middle panel). The levels of SNX27 and GAPDH proteins were determined and the amount of SNX27 in the transfected cells compared to the mock, normalised according to the GAPDH loading control is shown as a bar graph (right panel). Data from three biological and two technical replicates is shown as mean ± standard error. Significance was calculated using the one sample t-test; ns – not significant, *P < 0.05, ***P < 0.001.

