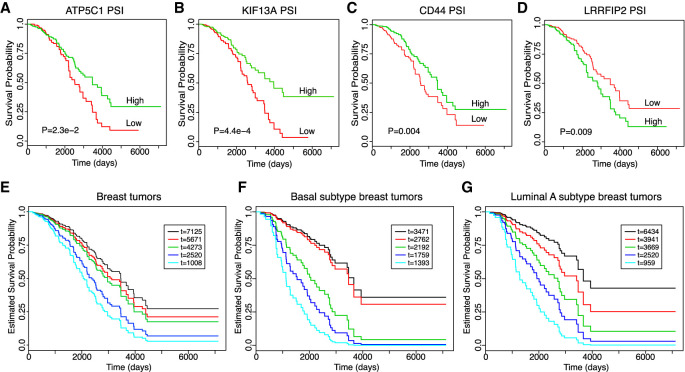
FIGURE 5.
AS levels predict patient survival. (A–D) Kaplan-Meier survival plots of BRCA patients from TCGA stratified by the exon-inclusion level of four of the 25 EMT AS events. High PSI is 50% above the average PSI value while low PSI is 50% below the average PSI value. The “survdiff” function in R is used to compute P-values using the log-rank test. (E–G) Alternative splicing of the genes ATP5C1, KIF13A, CD44, and LRRFIP2 are used to predict the survival of five randomly selected patients from TCGA using the Cox proportional hazard model. The known patient survival times from TCGA are indicated in the inserted boxes as “t=” with the unit as days. The estimated survival probabilities over time by PSI values are plotted, and the color code of each patient survival curve corresponds to the same patient with indicated survival time from TCGA in the inserted box. Patients are randomly selected without specifying a breast cancer subtype (E), from the basal subtype (F), or from the luminal A subtype (G). Regardless of subtype classification, patients with the longer survival time in TCGA showed better predicted survival and vice versa.

