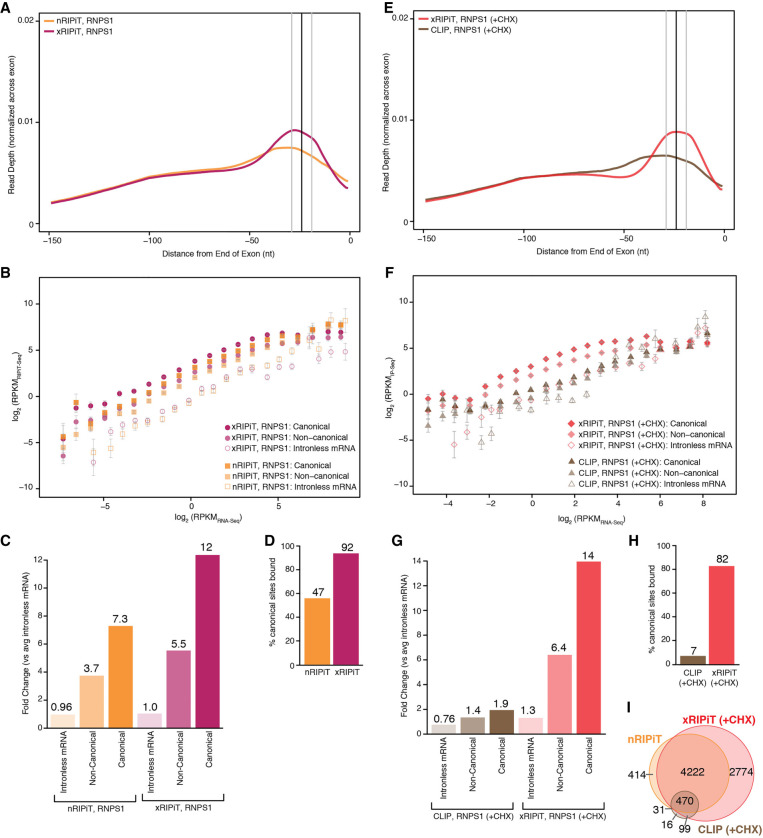
FIGURE 5.
xRIPiT-seq outperforms nRIPiT-seq and CLIP-seq to detect RNPS1 binding sites. (A) A meta-exon plot showing RNPS1 nRIPiT and xRIPiT footprint read counts at each position in the 150 nt window from exon ends. (B) Comparison of gene-level RNPS1 read density (RPKM) in nRIPiT (squares) and xRIPiT (circles) for canonical (darker-shaded shapes) and noncanonical regions (lighter-shaded shapes), and for intronless genes (empty shapes). Gene bins along the x-axis and error bars are as in Figure 3B. (C) Comparison of linear fit coefficients (or intercepts, in log space) of the six classes in B, which are labeled on the bottom. (D) Percentage of all canonical EJC regions where read depth is greater than or equal to twofold as compared to intronless read counts in the indicated data sets. (E) A meta-exon plot showing RNPS1 xRIPiT and CLIP footprint read counts at each position in the 150 nt window from exon ends. (F) Comparison of normalized read density (RPKM) in xRIPiT (diamonds) and CLIP (triangles) for canonical (darker-shaded shapes) and noncanonical regions (lighter-shaded shapes), and for intronless genes (empty shapes). The bins of genes along the x-axis and the error bars are as in Figure 3B. (G) Comparison of linear fit coefficients (or intercepts, in log space) of the six data sets in F. (H) Percentage of all canonical EJC regions where read depth is greater than or equal to twofold as compared to intronless gene read counts. (I) Venn diagram showing counts of canonical regions from the top 20% expressed genes where RNPS1 footprint read depth in nRIPiT, xRIPiT, and CLIP is greater than or equal to twofold as compared to intronless gene read counts.

