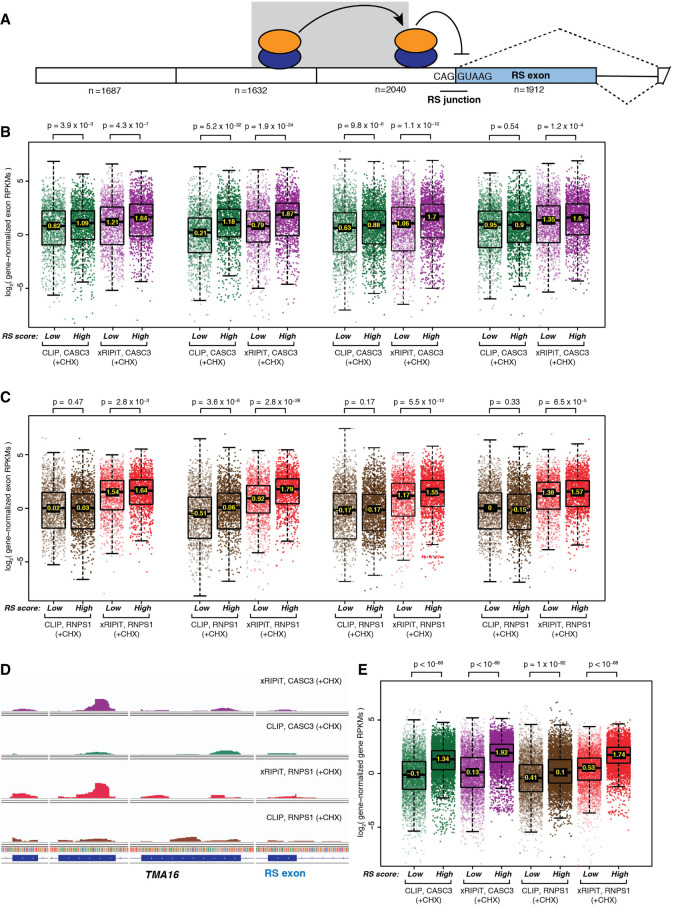
FIGURE 6.
Comparison of xRIPiT-seq and CLIP-seq signal for RNPS1 and CASC3 occupancy on high- and low-scoring RS exons and their neighboring exons. (A) A schematic of recursively spliced (RS) exon and its neighboring exons. Empty rectangles: constitutive exons; shaded rectangle: RS exon; black line: intron; dotted lines: possible exon splicing patterns; shaded ovals: RNPS1-EJC; RNPS1-EJCs upstream of RS junction suppresses RS, whereas the complex on one exon further upstream (shown on shaded background) stabilizes the downstream complex. The number below each exon represents the number of exons for which data is presented in panels B and C. (B) Box plots showing CASC3 xRIPiT-seq and CLIP-seq read densities on high-scoring versus low-scoring RS exon and its three preceding exons. Each set of four boxplots is arranged directly below the RS exon or the one of its three preceding exons it corresponds to in A. (Top) Wilcoxon rank-sum test P-values. (C) Box plots as in B showing RNPS1 xRIPiT-seq and CLIP-seq exonic read densities. (D) Integrated genome viewer tracks showing read coverage (normalized for library size) on TMA16’s RS exon and its three preceding exons. (E) Box plots showing RNPS1 and CASC3 xRIPiT-seq and CLIP-seq genic read densities on genes that contain a high-scoring RS exon (n = 5001) and those containing only low-scoring RS exons (n = 5001). (Top) Wilcoxon rank-sum test P-values.

