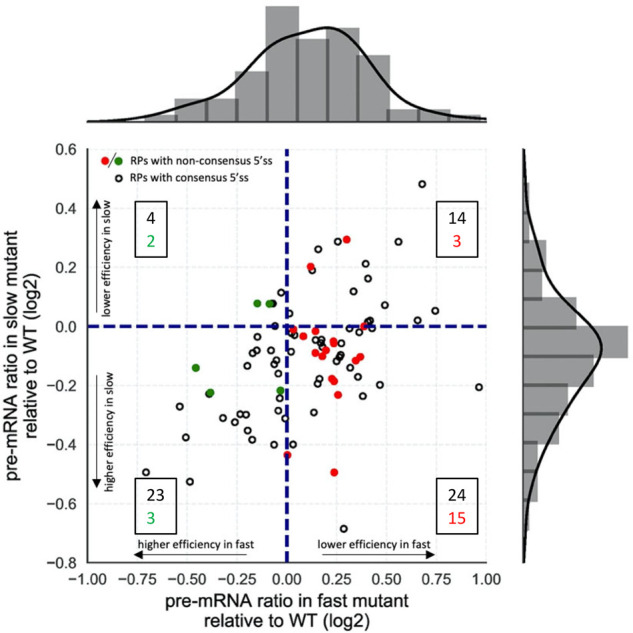
FIGURE 1.

Faster transcription reduces and slower transcription increases the efficiency of splicing RP transcripts with non-canonical 5′ splice sites. Splicing efficiencies were calculated (Supplemental Table S1) as RNA-seq read counts from pre-mRNA divided by total reads (pre-mRNA + mRNA) for each transcript (Aslanzadeh et al. 2018). Transcripts that splice significantly more or less efficiently in the fast mutant compared to WT lie to the left and right of the vertical dashed line, respectively. Those that splice more or less efficiently in the slow mutant compared to WT lie below or above the horizontal dashed line, respectively. RP transcripts with non-consensus 5′SS are represented by green (more efficiently spliced in the fast mutant) or red (less efficiently spliced in the fast mutant) dots. The boxed numbers indicate the number of genes represented in each quadrant, consensus in black, non-consensus in colored font. Histograms show the distribution of pre-mRNA ratios relative to WT in the fast (top) and slow (right) mutants. In the fast mutant there are more genes with increased pre-mRNA ratio (reduced splicing efficiency) relative to WT and in the slow mutant there are more genes with reduced pre-mRNA ratio (increased splicing efficiency) relative to WT.
