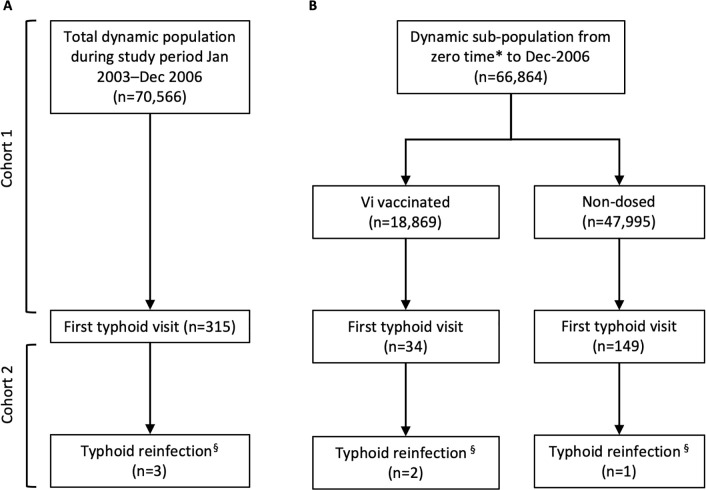
Fig 1.
CONSORT diagram showing culture-positive S. Typhi first and second visits in A) the total population during the study period of January 1, 2003 until December 31, 2006, and B) sub-populations of Vi-vaccinated and non-dosed individuals from zero time to December 31, 2006. Note: In- and out-migratory populations are not reflected in this diagram. *Given as date of vaccination occurring between November 27, 2004 and December 31, 2004. § Based on pairwise SNP difference >5.

