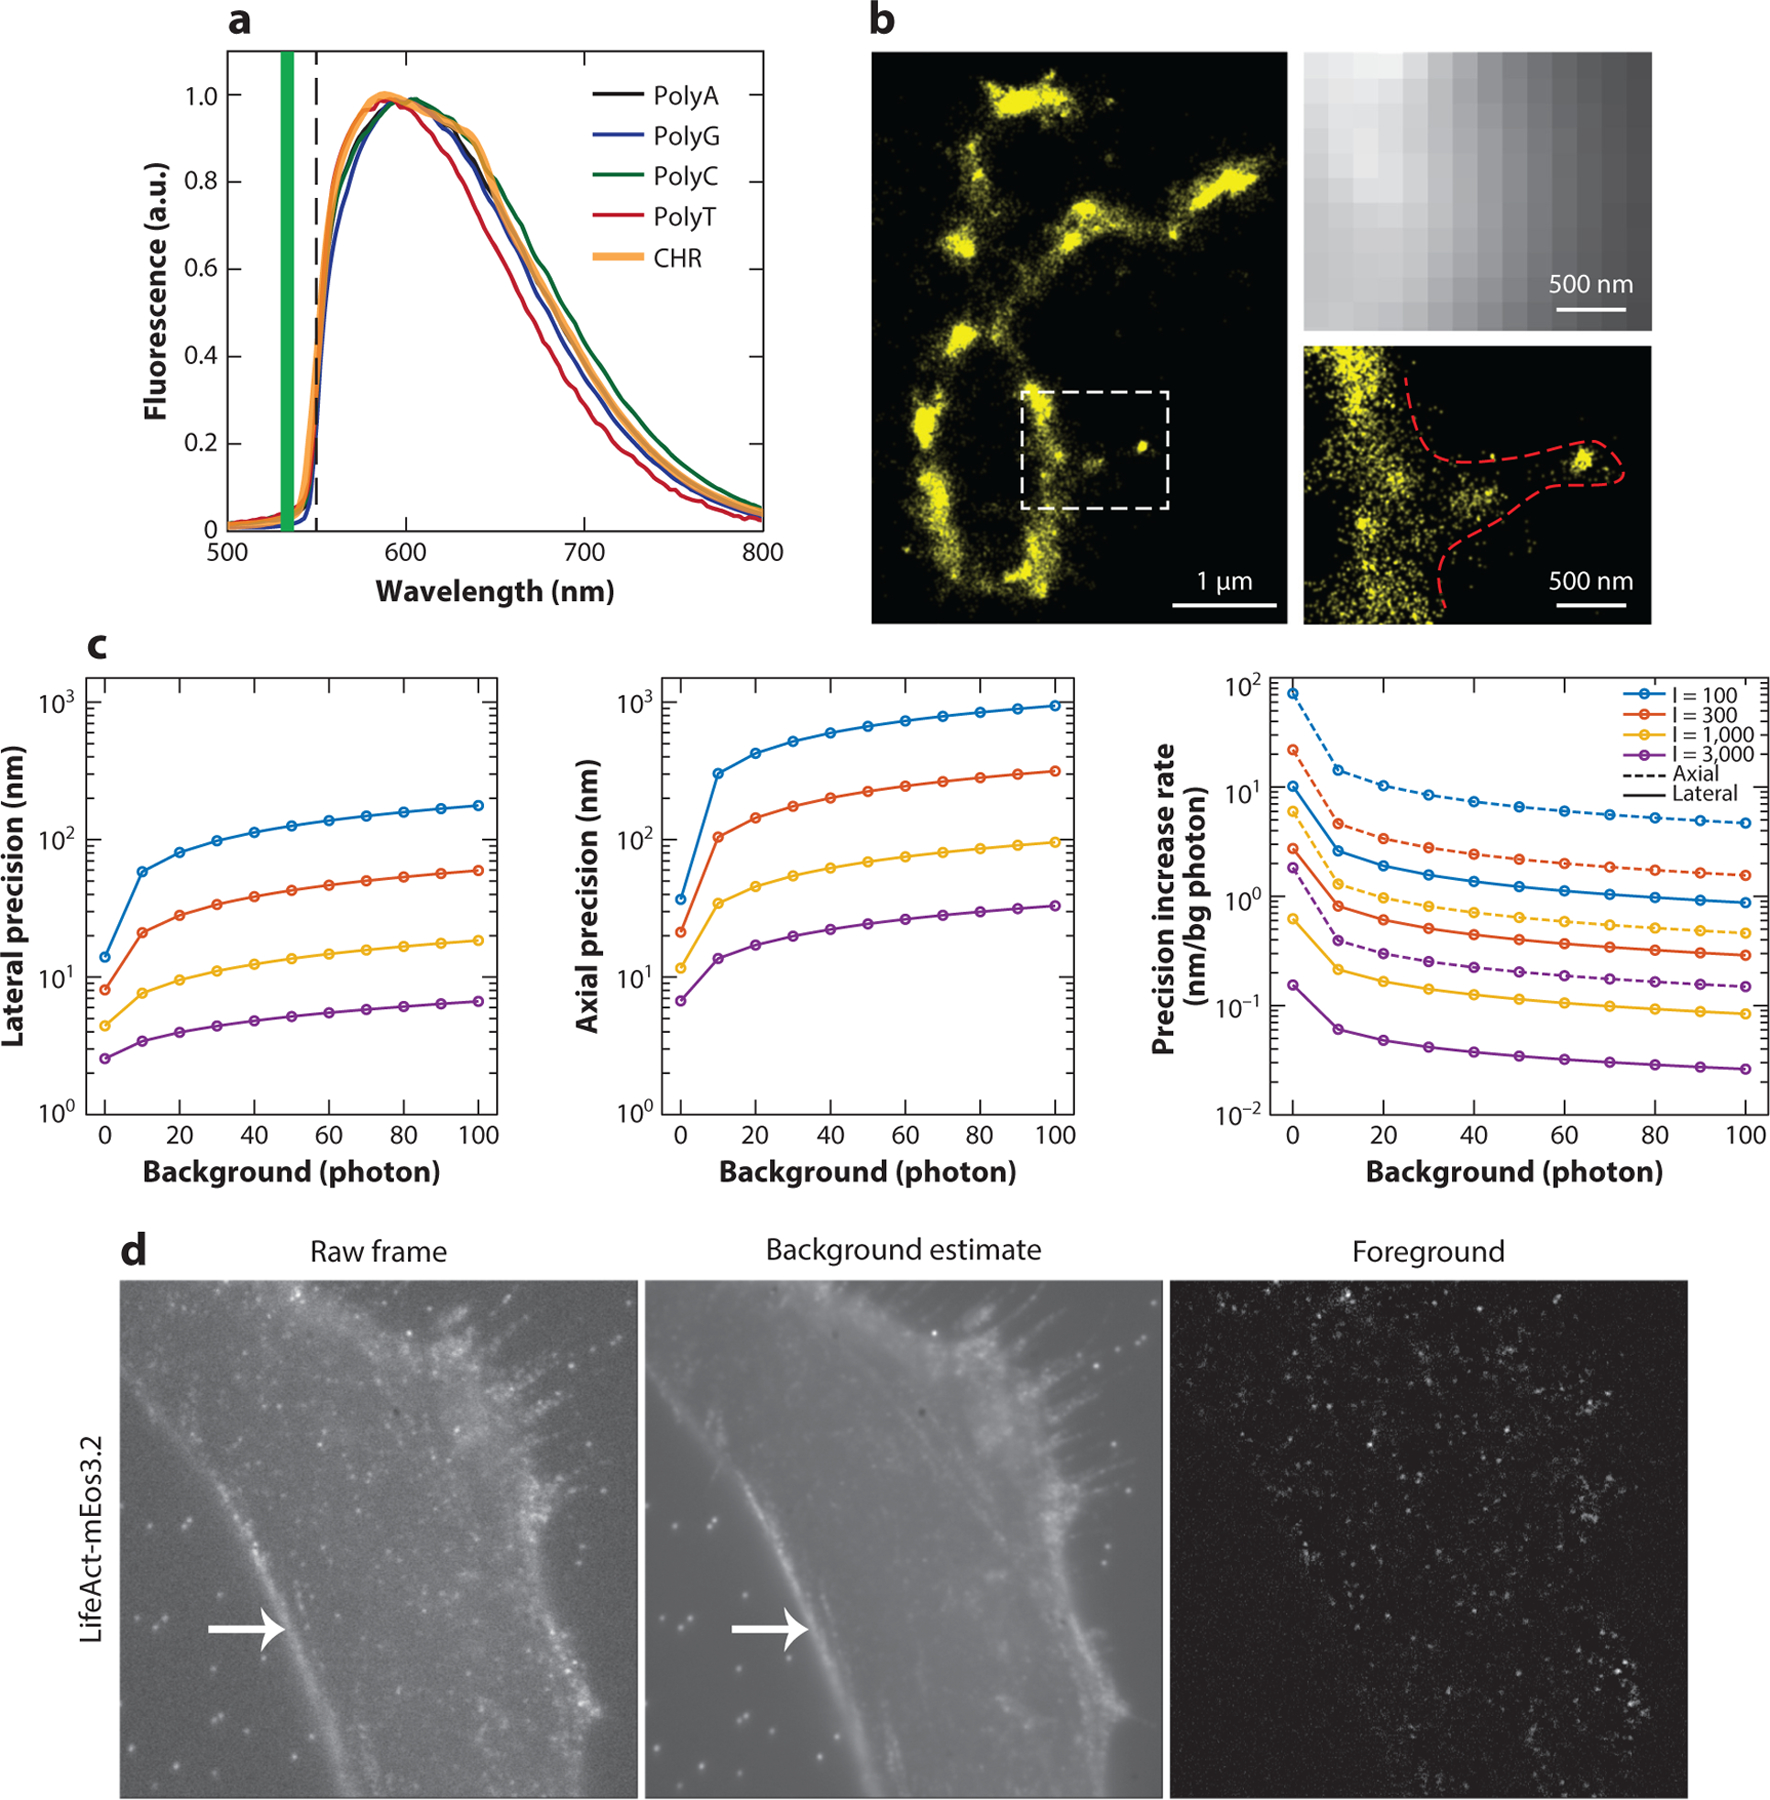
Figure 1.

Examples of background fluorescence, its effect on localization precision, and super-resolution microscopy methods based on autofluorescence from polynucleotides. (a) Fluorescence spectra of the polynucleotides PolyA, -G, -C, and -T and an isolated chromosome (CHR) sample. Abbreviation: a.u., arbitrary unit. Panel a adapted from Reference 18 with permission. (b) (Left) Single-molecule photon localization microscopy (PLM) image of DNA with x-shaped chromosomes separated from HeLa cells. (Right) Wide-field fluorescence and DNA-PLM images of the squared region on the left image show additional fine features that are not resolvable in a wide-field image. Panel b adapted from Reference 18 with permission. (c) The lower bounds of localization precision and their deterioration rates at various photon and background levels. Precision lower bounds were calculated from the Cramér–Rao lower bound (CRLB) given a point spread function (PSF) model without aberration (lateral) or with astigmatism aberration (axial; aberration amplitude = 1.5 λ/2π), assuming that detected photoelectrons follow a Poisson distribution. The background (bg) level is the bg photon per pixel. The emitted photon (I) equals the sum of all pixel intensity after bg subtraction. The simulation parameters include the numerical aperture (1.49), emission wavelength (0.69 μm), pixel size (50 nm), and PSF subregion size (64 × 64 pixels). Lateral precision was calculated at an in-focus position (z = 0), and the axial precisions were calculated by averaging across an axial range from −400 nm to 400 nm. (d) (Left) Raw camera frame of a single-molecule data set with the actin cytoskeleton marker LifeAct-mEos3.2. Middle) Background fluorescence estimated using a temporal median filter. (Right) Foreground shown after background subtraction. The fiducial beads that are visible in the raw frame and background image are no longer apparent in the foreground image, nor is the ridge at the cell boundary (arrow). Panel d adapted from Reference 17 with permission.
