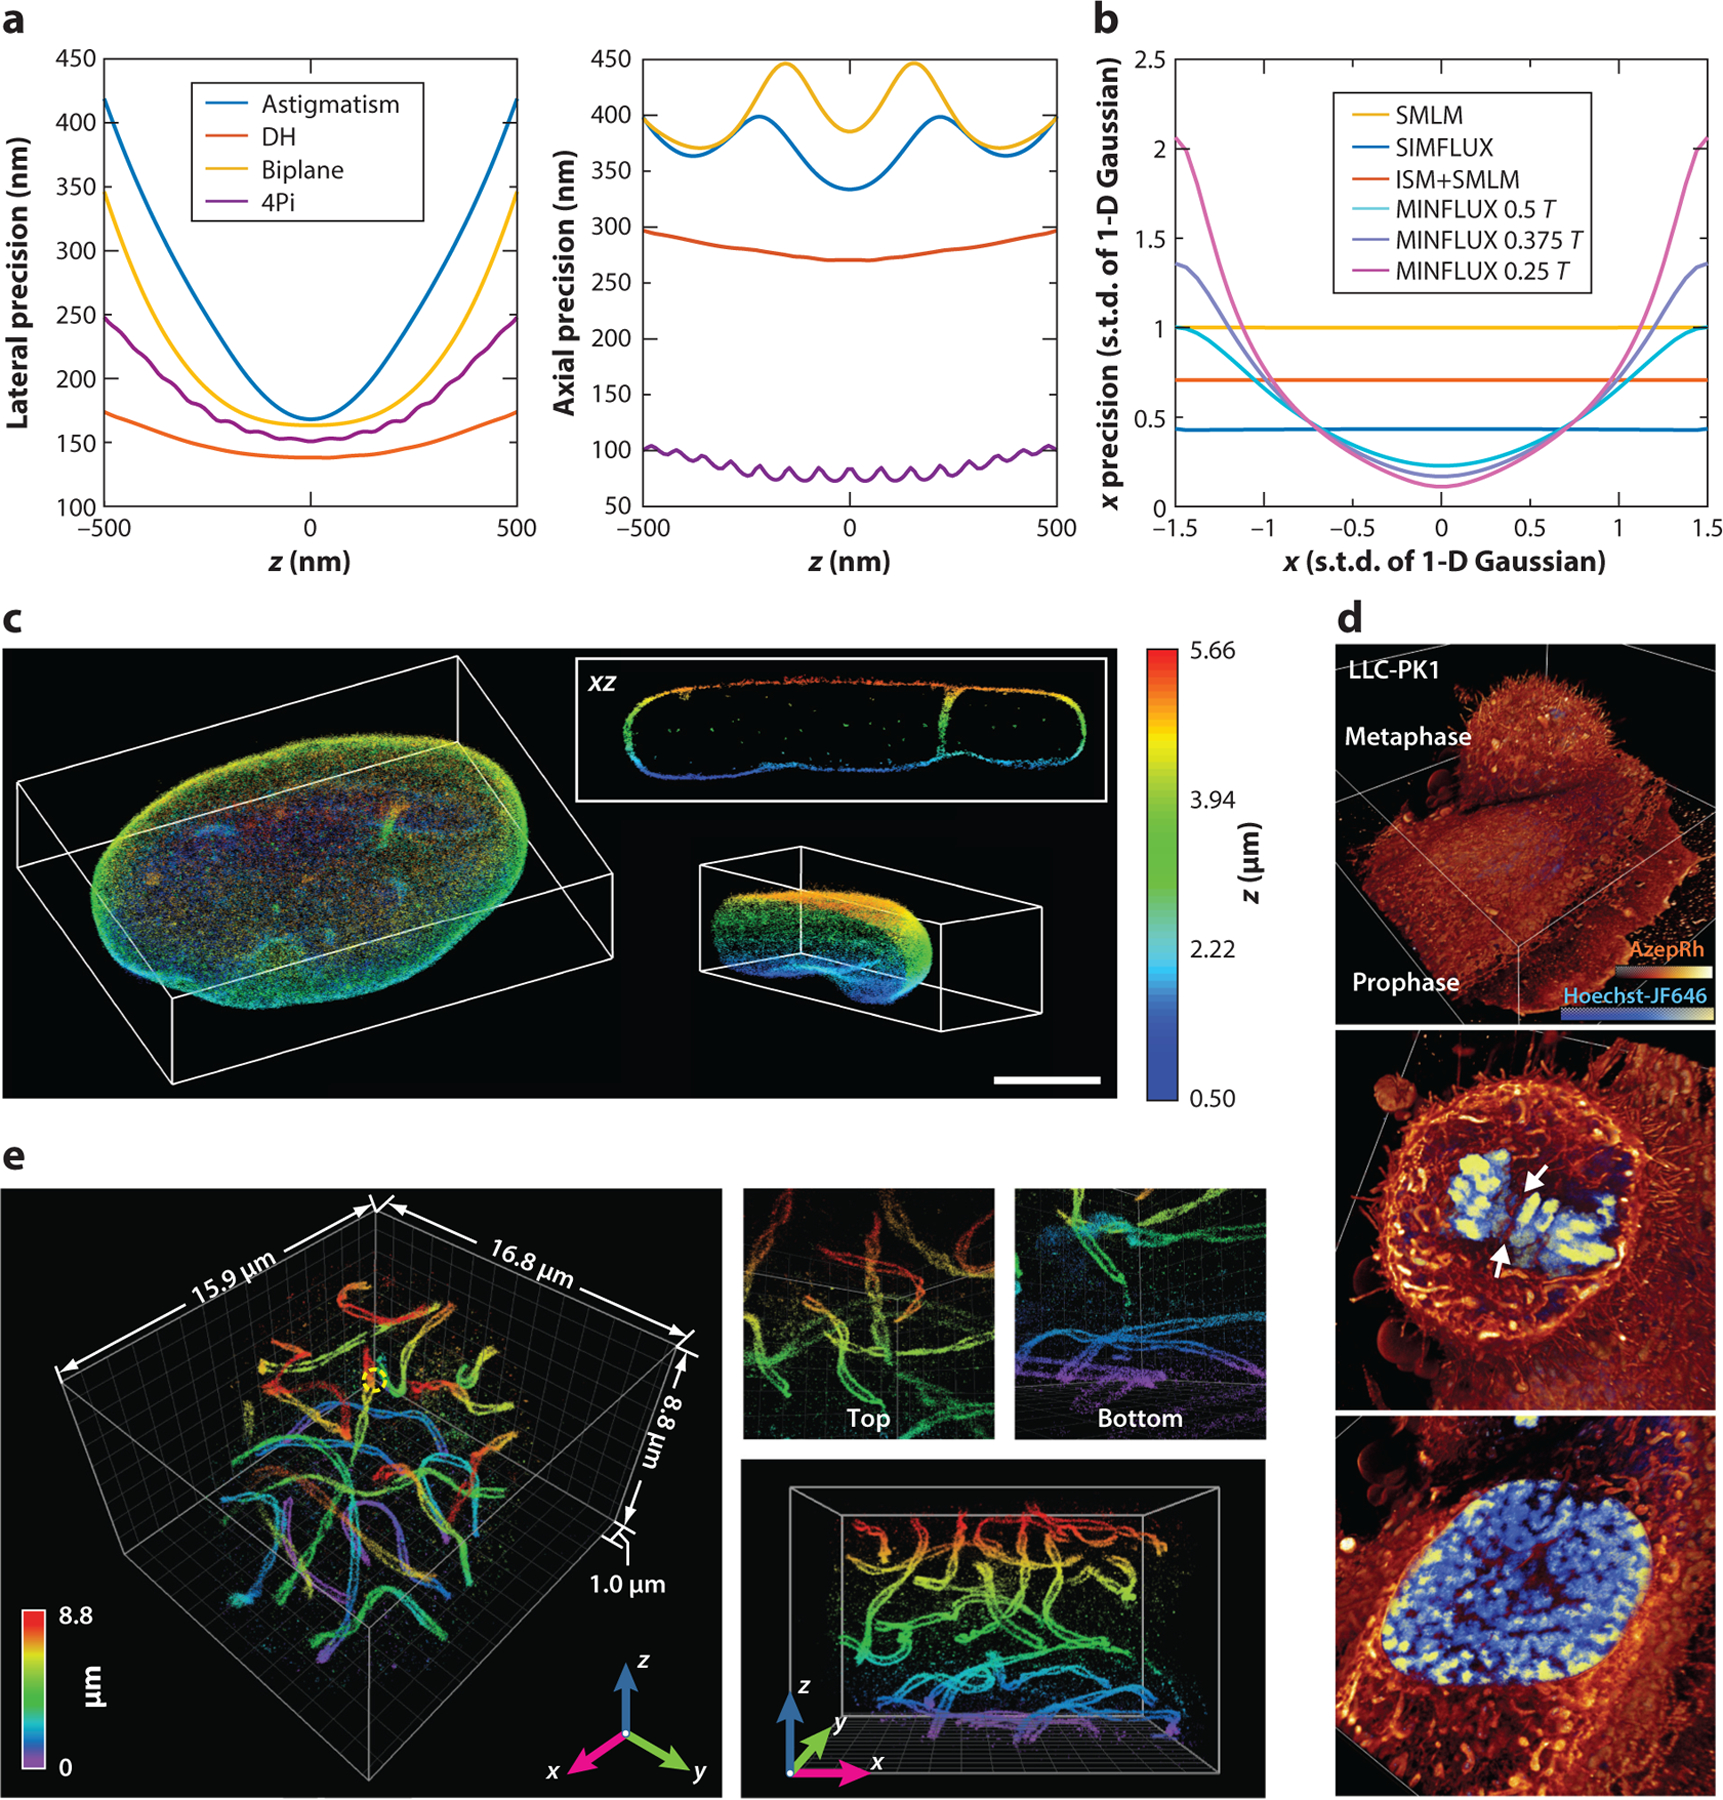
Figure 3.

(a) Lower bounds of lateral and axial localization precision when using different three-dimensional (3-D) single-molecule localization microscopy (SMLM) modalities with a single emitted photon and near zero background (10−6). Precision values were calculated from Cramér–Rao lower bounds and assume a Poisson distribution for detected photoelectrons. Double-helix (DH) point spread functions (PSFs) were generated from Gaussian–Laguerre modes and efficiency optimized for pupil function. Astigmatism PSFs were generated from the fifth Zernike polynomial (Wyant order) with an amplitude of 1.5 (λ/2π), and biplane PSFs used ideal PSFs (i.e., with no aberration) for each plane, with an optimized plane distance of 305 nm. 4Pi (interferometric) PSFs were generated based on coherent pupil functions, with an astigmatism aberration of 1.5 (λ/2π) that had perfect coherence and zero transmission loss. To avoid computational instabilities, we used a background of 10−6 photons per pixel for single-plane PSF models (astigmatism and DH), 10−6/2 for biplane PSFs, and 10−6/4 for 4Pi PSFs. For each PSF model, to evaluate the precision achieved by one expected photon count, the sum of all pixel values after background subtraction is one. DH PSFs give the lowest lateral precision with the least increase over z, partially benefiting from the side lobes of the shape-invariant PSFs. 4Pi PSFs give the lowest axial precision, taking advantage of coherent detection of single molecules. Other simulation parameters include the numerical aperture (1.49), emission wavelength (0.69 μm), pixel size (50 nm), and PSF subregion size (64 × 64 pixels). (b) Lower bounds of 1-D localization precision when using different patterned excitation SMLM methods. A 1-D Gaussian model with a width of one pixel was used for both the emission PSF and the excitation PSF in image-scanning microscopy (ISM). A 1-D sinusoid pattern with a period of 3 pixels (T = 3 pixels) was used for both the structured illumination (SIM) and the minimal emission fluxes (MINFLUX). Here, precision was calculated at one photon in total and zero background. Abbreviation: s.t.d., standard deviation. (c) 3-D SMLM reconstructions of the entire nuclear lamina (lamin B1) of a HeLa cell made using tilted light-sheet microscopy with 3-D PSFs (TILT3D). Scale bar: 5 μm. Panel c adapted from Reference 55 with permission. (d) Volume rendering of two dividing LLC-PK1 cells in prophase (bottom) and metaphase (top) labeled with Hoechst-JF646 and AzepRh to visualize DNA and intracellular membranes, seen using 3-D lattice light-sheet illuminated 3-D SMLM. Panel d adapted from Reference 24 with permission. (e) 3-D super-resolution volumes of synaptonemal complexes in a whole-mouse spermatocyte obtained by 4Pi (interferometric)-based single-molecule detection and localization assisted by adaptive optics. Panel e adapted from Reference 92 with permission.
