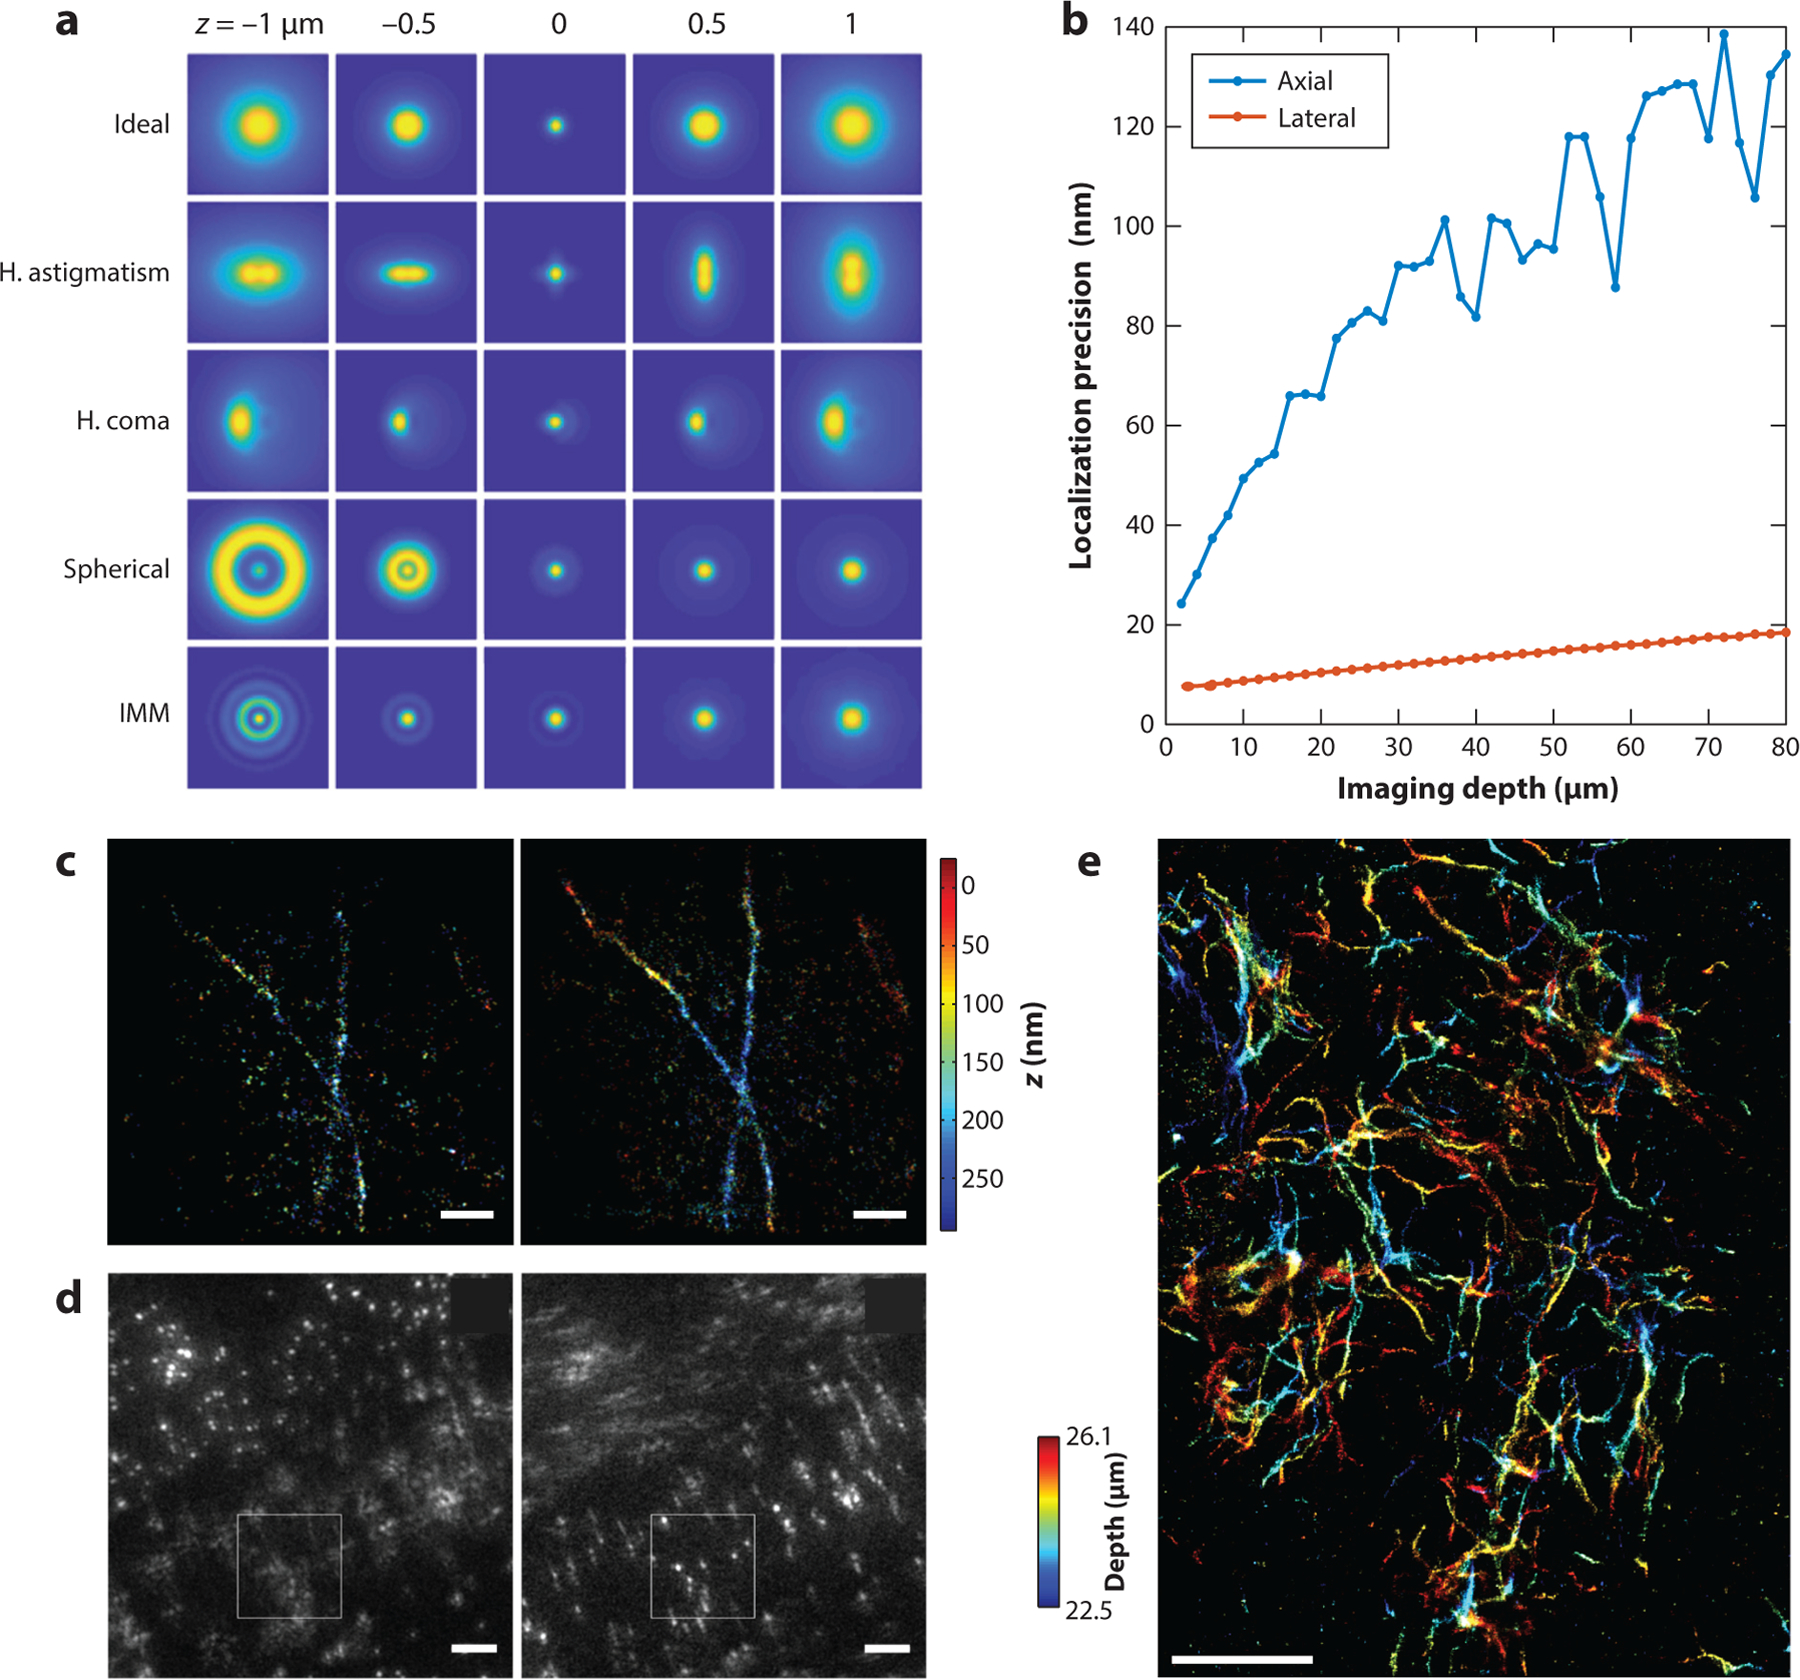
Figure 4.

(a) Examples of three-dimensional (3-D) point spread functions (PSFs) based on a high–numerical aperture (NA) imaging system, showing various aberrations, including horizontal astigmatism (H. astigmatism), horizontal coma (H. coma), spherical, and index mismatch aberration (IMM). Ideal PSFs were also generated for comparison. The simulation parameters include the NA (1.49), emission wavelength (0.69 μm), pixel size (50 nm), and PSF subregion size (64 × 64 pixels). For astigmatism, coma, and spherical aberration, the amplitudes of the corresponding Zernike polynomials (fifth, seventh, and ninth; Wyant order) are, respectively, 1.5, 1.5, and −1.5 (units, λ/2π). For IMM, the imaging depth (stage position) was set to 10 μm, and the refractive indices of the immersion and the sample media are, respectively, 1.52 and 1.33. (b) Lower bounds of lateral and axial localization precision at different imaging depths were calculated using biplane detection when considering refractive IMM. The parameters used in the simulation include the NA (1.4), the refractive index of the objective immersion medium (1.52), the refractive index of the sample immersion medium (1.33), wavelength (0.7 μm), number of emitted photons per single molecule (1,000), and background fluorescence per pixel (10). The precision values at image depths from 2 to 80 μm are shown. At each depth, 101 PSFs at z positions uniformly distributed from −600 nm to 600 nm relative to the apparent focal position were simulated. The average precision in the lateral and axial directions are reported at each depth. (c) 3-D single-molecule localization microscopy (SMLM) images of immune-labeled α-tubulin in COS-7 cells, with (left) the adaptive optics (AO) set to correct for instrumental aberrations only and (right) the AO set to correct for instrumental- and specimen-induced aberrations. Scale bars: 1 μm. Panel c adapted from Reference 107 with permission. (d) Correction of aberration induced by Caenorhabditis elegans using a sensorless AO driven by a genetic algorithm. Scale bars: 5 μm. Panel d adapted from Reference 108 with permission. (e) 3-D SMLM image of an amyloid-β plaque in a 30-μm brain slice from a mouse model of Alzheimer’s disease. Image made using adaptive PSF shaping and sensorless AO driven by the Nelder–Mead simplex algorithm. Scale bar: 5 μm. Panel e adapted from Reference 80 with permission.
