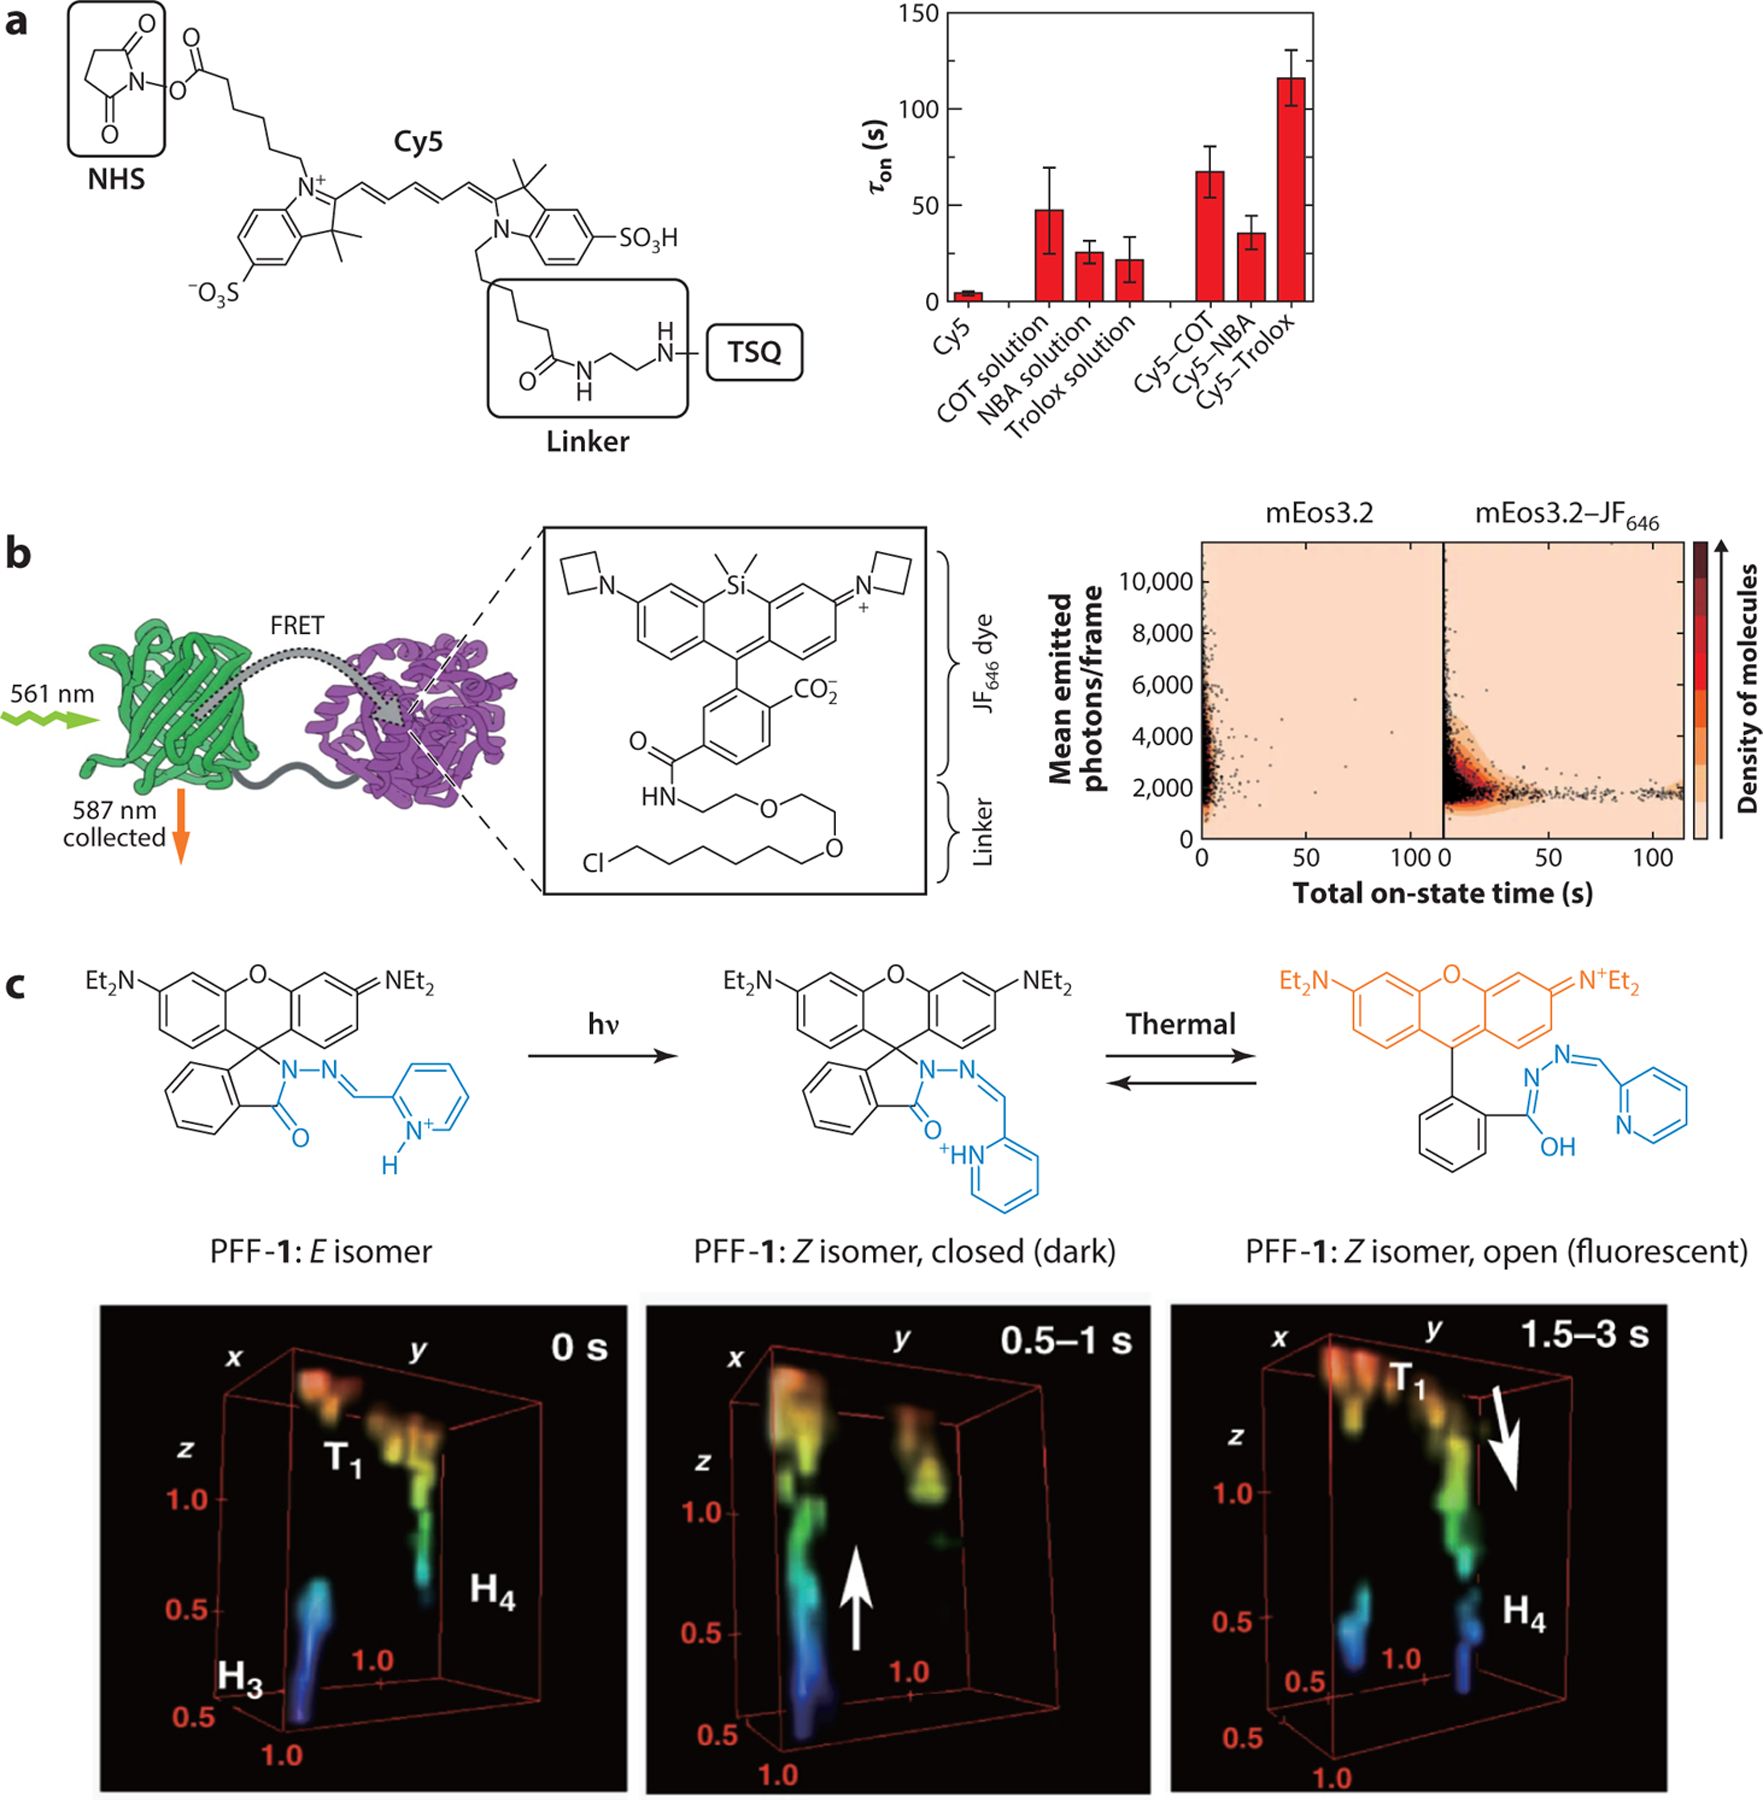
Figure 5.

(a) TSQ-conjugated Cy5 (left) and average photobleaching times (τon) with individual TSQs in solution or directly conjugated to Cy5 (right). Shown are error bars and standard deviations (n ≥ 6 movies from at least two independent experiments). (b) JF646-linked mEos3.2 (left) and 2-D histogram of total on-state time (i.e., individual track length), and total number of switching events per molecule when performing SMLM using either mEos3.2 or the mEos3.2–JF646 FRET pair. (c) Mechanism of the photoregulated fluxional fluorophore PFF-1 (top) and 3-D live-cell SMLM imaging of vesicle movement at a synapse, displaying a vesicle moving from hotspot H3 to H4 through track T1 (bottom). The volumes are colored according to the axial direction. The dimension of ROI is 1.5 μm × 1.5 μm × 1.5 μm. Panels a, b, and c adapted with permission from References 136, 137, and 138, respectively. Abbreviations: COT, 1,3,5,7-cyclooctatetraene; FRET, fluorescence resonance energy transfer; NBA, nitrobenzyl alcohol; NHS, N-hydroxysuccinimidyl ester; ROI, region of interest; SMLM, single-molecule localization microscopy; TSQ, triplet-state quencher.
