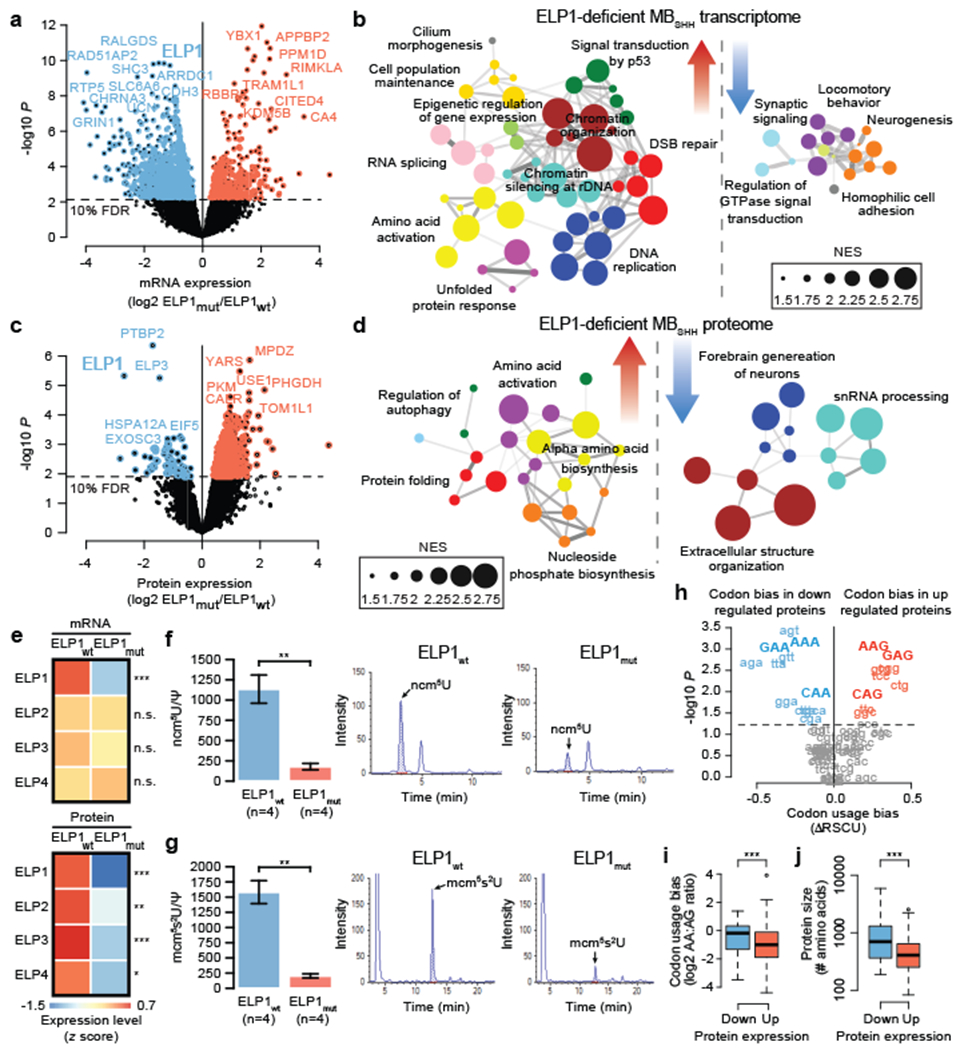
Figure 4. Molecular features of ELP1-associated medulloblastoma.

a. Differential gene expression between ELP1mut MBSHH (n=10) and ELP1wt, MBSHH (n=90). P values were derived from models that use negative binomal test statistics and were adjusted for multiple testing based on FDR correction.
b. Functional gene enrichment in ELP1mut MBSHH.
c. Differential protein expression between ELP1mut MBSHH (n=6) and ELP1wt, MBSHH (n=9). P values were derived from linear models that use empirical Bayes statistics and were adjusted for multiple testing based on FDR correction.
d. Functional protein enrichment in ELP1mut MBSHH.
e. Gene expression of Elongator subunits in ELP1mut MBSHH (n=10) and ELP1mut MBSHH (n=80) and protein expression of Elongator subunits in ELP1mut MBSHH (n=6) and ELP1mut MBSHH (n=9). P values were derived from models that use negative binomal test statistics and empirical Bayes statistics. *P<0.05, **P<0.01, ***P<0.001, n.s. P>0.10.
f. Quantification of ncm5U nucleosides in ELP1mut MBSHH (n=4 biologically independent samples) and ELP1wt MBSHH (n=4 biologically independent samples). P values were calculated using two-sided Welch t-tests. Mean values and standard errors are shown. **P<0.01.
g. Quantification of mcm5s2U nucleosides in ELP1mut MBSHH (n=4 biologically independent samples) and ELP1wt MBSHH (n=4 biologically independent samples). P values were calculated using two-sided Welch t-tests. Mean values and standard errors are shown. **P<0.01.
h. Codon usage bias (ARSCU) in ELP1mut MBSHH (n=6) vs ELP1wt MBSHH (n=9). P values were calculated using two-sided Mann–Whitney U-tests and adjusted for multiple testing using FDR correction.
i. Codon usage bias (AA- vs AG-ending codons) in ELP1mut MBSHH (n=6) vs ELP1wt MBSHH (n=9). P value was calculated using a two-sided Mann–Whitney U-test. ***P<0.001. Boxes show median, first and third quartile, and whiskers extend to 1.5× the interquartile range.
j. Protein size distribution in ELP1mut MBSHH (n=6) vs ELP1wt MBSHH (n=9). P values were calculated using a two-sided Mann–Whitney U-test. ***P<0.001. Boxes show median, first and third quartile, and whiskers extend to 1.5× the interquartile range.
