
Extended Data Figure 5. Molecular features of ELP1-associated medulloblastoma.
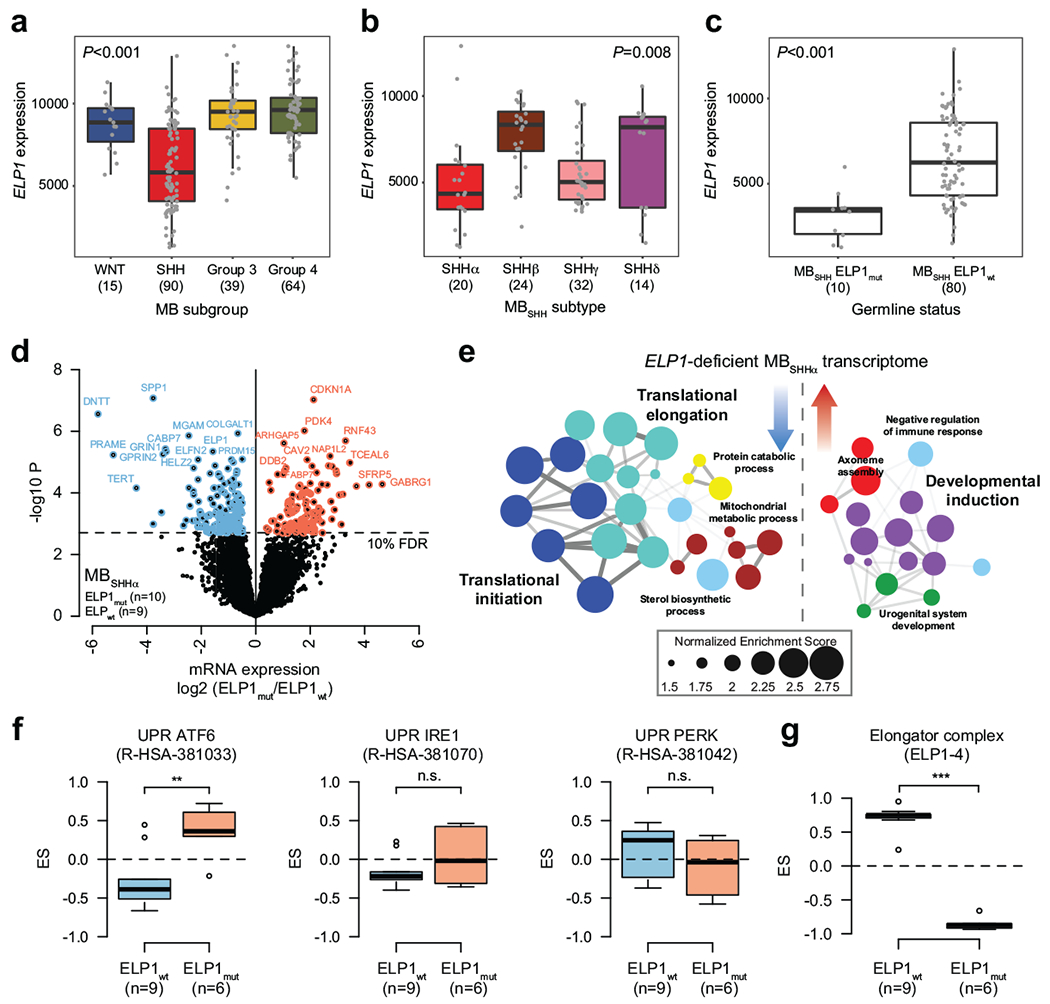
a. ELP1 expression stratified by consensus MB subgroup (n=208 patients). P value was calculated using likelihood ratio tests. Boxes show median, first and third quartile, and whiskers extend to 1.5× the interquartile range.
b. ELP1 expression stratified by molecular MBSHH subtype (n=90 patients). P value was calculated using likelihood ratio tests. Boxes show median, first and third quartile, and whiskers extend to 1.5× the interquartile range.
c. ELP1 expression stratified by germline ELP1 mutation status (n=90 patients). P value was calculated using likelihood ratio tests. Boxes show median, first and third quartile, and whiskers extend to 1.5× the interquartile range.
d. Differential gene expression in ELP1mut (n=10) and ELP1wt SHHα (n=9). P values were derived from models that use negative binomal test statistics and were adjusted for multiple testing based on FDR correction.
e. Functional gene enrichment in ELP1-associated SHHα.
f. GSEA-based enrichment of UPR pathways in MBSHH proteomes. P values were calculated using a two-sided Mann-Whitney U-test. **P<0.01; ns P>0.05. Boxes show median, first and third quartile, and whiskers extend to 1.5× the interquartile range.
g. GSEA-based enrichment of the Elongator complex in MBSHH proteomes. P value was calculated using a two-sided Mann-Whitney U-test. ***P<0.001; Boxes show median, first and third quartile, and whiskers extend to 1.5× the interquartile range.