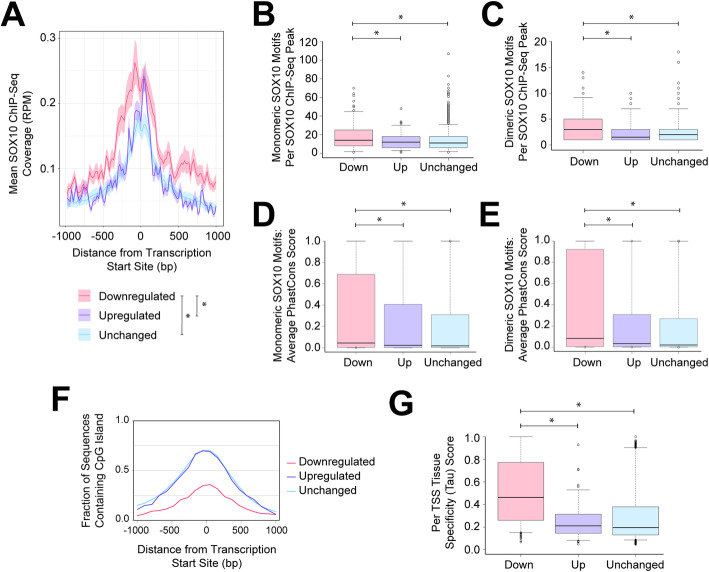
Fig. 4.
SOX10-dependent transcription start sites are associated with high-affinity SOX10 binding at conserved motifs and restricted expression profiles. a Aggregate SOX10 ChIP-Seq data in the 2-kilobase region surrounding TSSs that were downregulated, upregulated, or unchanged in ΔSOX10 S16 cells as in Fig. 3a. X-axis: genomic distance from the TSS (base pairs, bp). Y-axis: average SOX10 ChIP-Seq signal (RPM, reads per million). Asterisk indicates p < 0.001. b and c Monomeric (b) and dimeric (c) SOX10 binding motifs underlying SOX10 ChIP-Seq peaks associated with each class of TSS. Y-axis: distribution of number of motifs per peak. d and e Conservation scores of monomeric (d) and dimeric (e) SOX10 binding motifs as defined in panels b and c. Y-axis: distribution of conservation scores. b-e Whiskers extend to the 5th and 95th percentile of the data. Asterisks indicate p < 0.01. f CpG islands surrounding the downregulated, upregulated, and unchanged TSSs from the ΔSOX10 S16 model. X-axis: distance from the TSS (bp, base pairs). Y-axis: fraction of regions harboring a CpG island, calculated in 100 bp bins. g Tau scores for TSSs that were downregulated, upregulated, and unchanged in the ΔSOX10 S16 model, measured across 11 mouse tissues. Y-axis: distribution of Tau scores. Whiskers extend to the 5th and 95th percentile of data. Asterisk, p < 0.001

