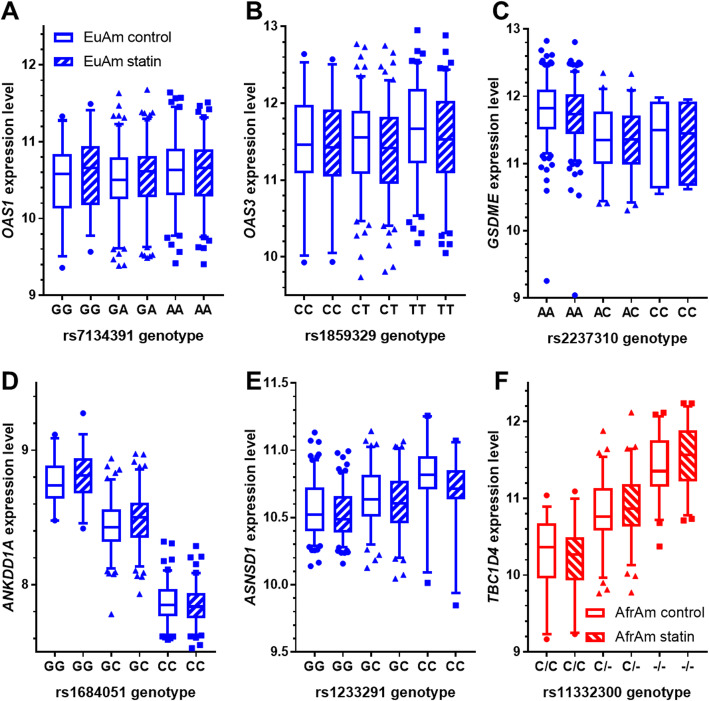
Fig. 4.
Control and statin-treated gene expression levels split by deQTL genotype for lead deQTLs unique to ancestry subsets. a-e Significant lead deQTLs unique to the European ancestry subset. f Significant lead deQTL unique to the African American subset. Genes for which the lead deQTL variant was the same in the European ancestry subset and meta-analysis are shown in Fig. 5 only. In all cases, the reference allele is on the left. Whiskers mark the 5th and 95th percentiles. Approximate fold changes were calculated by taking 2^(statin-treated minus endogenous variance stabilized gene expression levels) for display purposes. Sample sizes match those in Fig. 2

