
Figure 2.
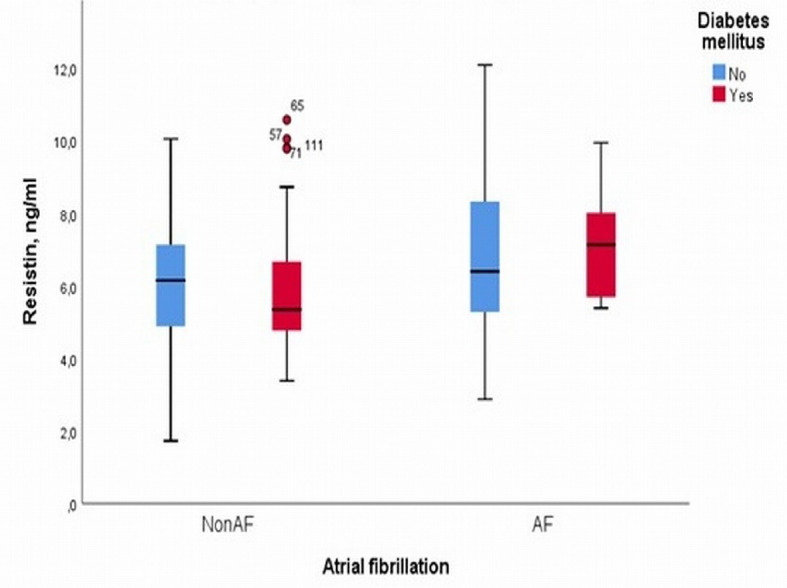
Boxplot graph for the levels of resistin in the blood plasma of patients with and without permanent atrial fibrillation depending to diabetes mellitus.
Official websites use .gov
A
.gov website belongs to an official
government organization in the United States.
Secure .gov websites use HTTPS
A lock (
) or https:// means you've safely
connected to the .gov website. Share sensitive
information only on official, secure websites.
Boxplot graph for the levels of resistin in the blood plasma of patients with and without permanent atrial fibrillation depending to diabetes mellitus.