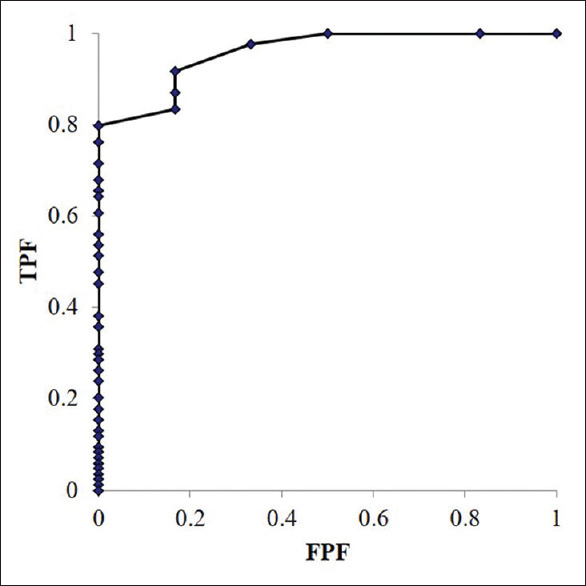
Figure 2.

Receiver operating characteristic curves calculated from the stereomicroscopically visible white core lengths with respect to the diagnostic accuracy. The overall area under the curve is 0.958 (95% confidence interval: 0.897–1.020, P < 0.001). AUC: Area under the curve, CI: Confidence interval, ROC: Receiver operating characteristic, SVWC: Stereomicroscopic visible white core
