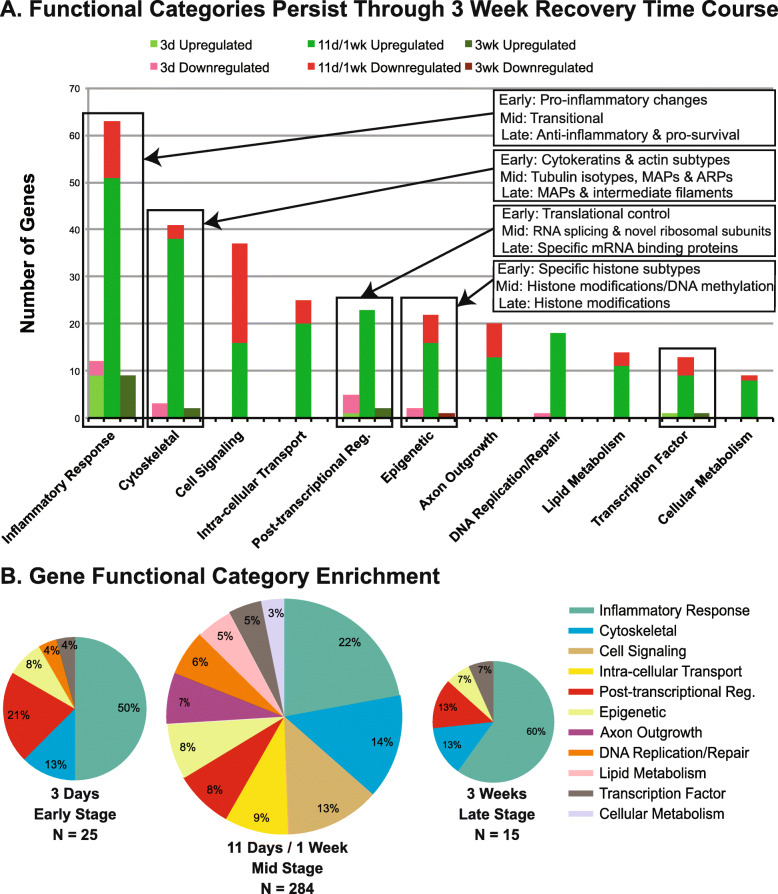
Fig. 4.
Grouping DESR genes by known functions provided insights into processes underlying successful CNS axon regeneration. a Curating DESR genes based on functions documented in the scientific literature (see text for details) parsed them into eleven categories. Vertical boxes outline functional categories present at all three time points. Boxes with arrows list prominent functional sub-categories at the different time points (see text for details). Green shades, upregulated genes; red shades, down-regulated genes (S & L homeologs tallied separately).b Pie charts display data from (a) according to each category’s relative contribution (%) to the total number of DESR genes and are scaled in size to reflect the total number of DESR genes at each time point (N). Additional_File6_DESR_Functional_Categories.pdf contains a list of the DESR genes, separated by time point and category, along with relevant literature citations supporting the functional categorization. Because functions are mostly based on mammalian studies, and Xenopus generally has more than one homeolog for each human gene, they are listed without regard to which homeolog is differentially expressed. Detailed data for individual homeologs are in Additional_File4_DESR_Data.xlsm

