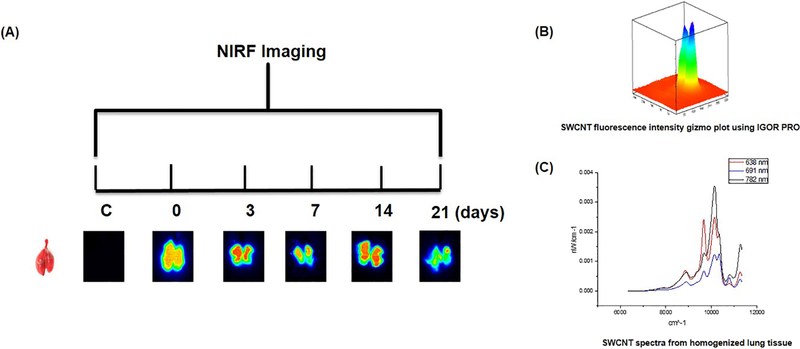
Figure 3.
(A) Timeline of near-infrared fluorescence images and bright field images of control and SWCNT-exposed lungs captured over the 21-day exposure period. (B) Example SWCNT pixel intensity plot used to quantify images. (C) Example NIRF spectra from homogenized tissue sample used to quantify SWCNTs

