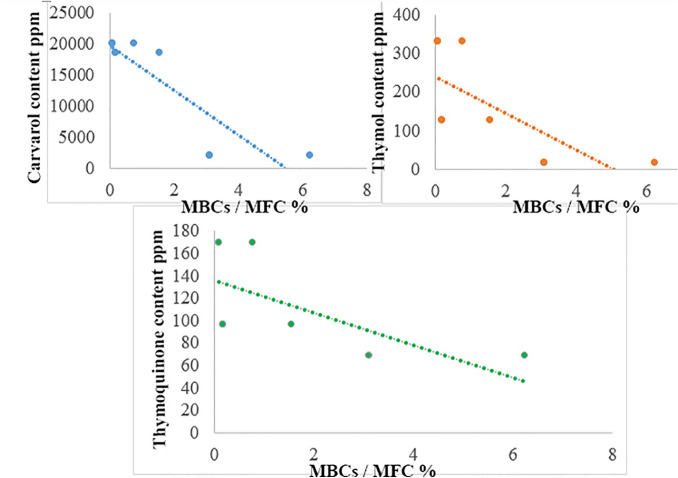
Fig. 2.
Pearson correlation test between carvacrol, thymol, and thymoquinone content and MBCs/MFC (R2 = coefficients of determination). Equations of regression: Carvacrol: y = – 3595.9x + 19,696 (R2 = 0.7714); Thymol: y = – 47.046x + 237.86 (R2 = 0.5117); Thymoquinone: y = – 14.483x + 136 (R2 = 0.4506)

