
Fig. 1.
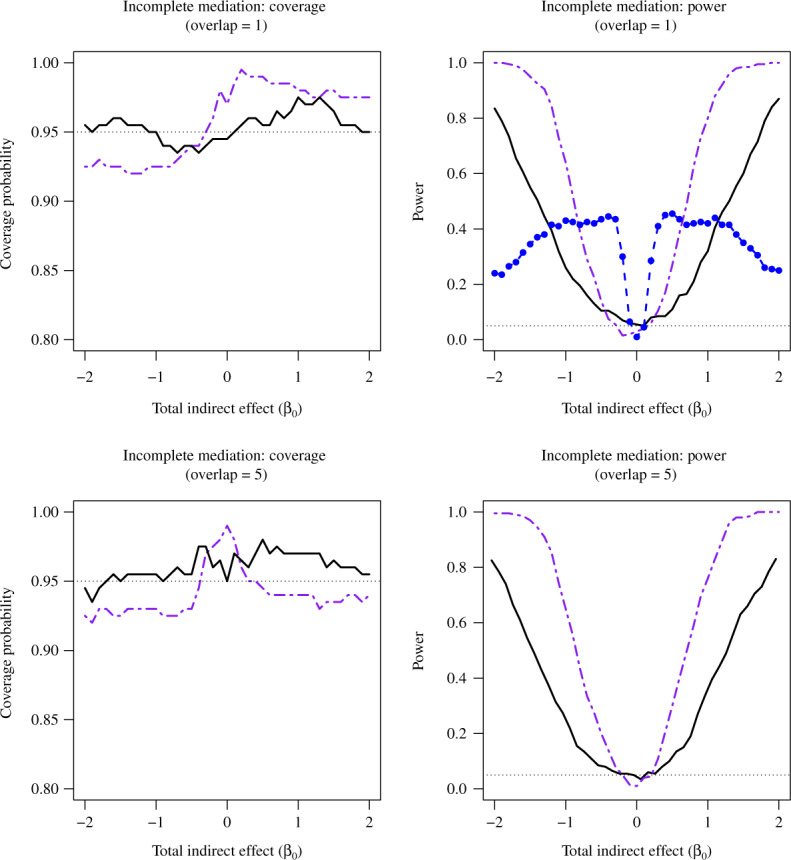
Average coverage probabilities of 95% confidence intervals (left panels) and average power curves at significance level  (right panels) for estimating and testing the indirect effect under incomplete mediation, over 200 replications. The direct effect was
  . The number of true mediators was 1 in the upper panels and 5 in the lower panels. Proposed (solid):
  from (6); Naive (dot-dash): the naive method discussed in § 5.1; Zhang (large dot-dash): method of Zhang et al. (2016).