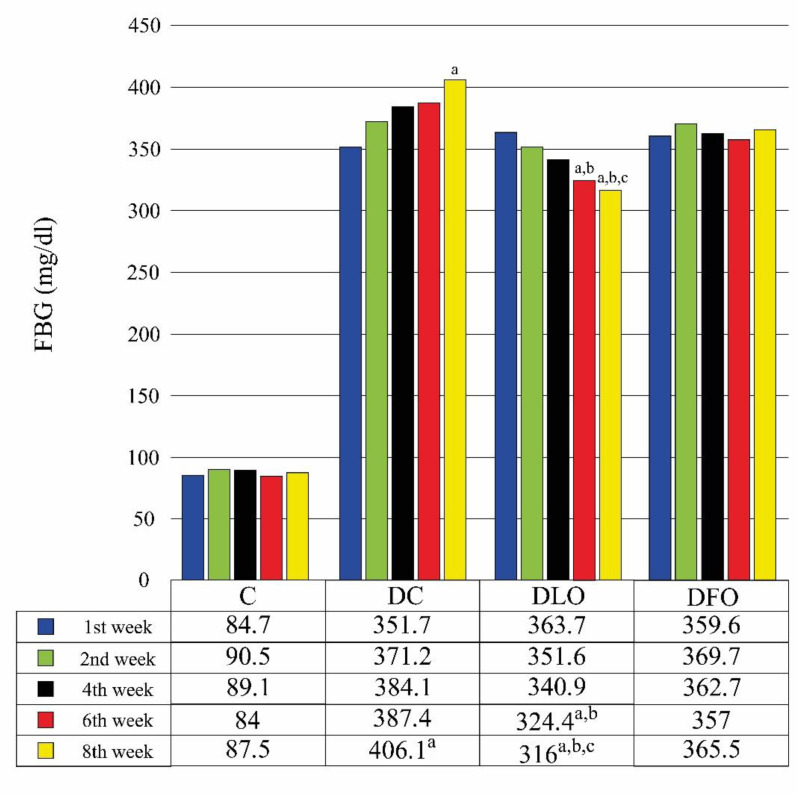
Figure 1.
Groups’ mean fasting blood glucose values (mg/dl) measured during the experiment (mean, n=8)
a Significantly different from the 1st week. b Significantly different from the 2nd week. c Significantly different from the 4th week. a,b,c (p<0.05). C: Control; DC: Diabetic Control; DLO: Diabetic + Lyophilized Onion; DFO: Diabetic + Furnaced Onion.

