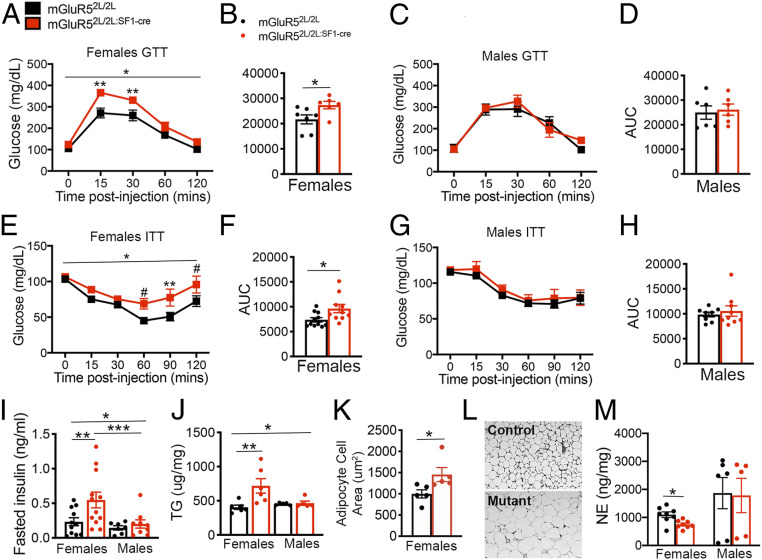
Fig. 2.
mGluR5 is required in female but not in male SF1 neurons for the regulation of glucose and lipid balance and sympathetic output. (A) Glucose tolerance test (GTT) in mGluR52L/2L:SF1-cre (n = 6) and mGluR52L/2L (n = 7) females. *Two-way ANOVA: genotype, P = 0.02; time, P < 0.0001; interaction, P = 0.006. Bonferroni’s multiple comparisons test: **P < 0.05. (B) Area under the curve (AUC) for the GTT in females. Two-tailed unpaired t test: *P = 0.04. (C) Glucose tolerance test (GTT) in mGluR52L/2L:SF1-cre (n = 6) and mGluR52L/2L (n = 6) males. (D) AUC for the GTT in males. (E) Insulin tolerance test (ITT) in mGluR52L/2L:SF1-cre (n = 10) and mGluR52L/2L (n = 11) females. *Two-way ANOVA: genotype, P = 0.02. Bonferroni’s multiple comparisons test: #P = 0.08; **P = 0.03. (F) AUC for the ITT in females. Two-tailed unpaired t test: *P = 0.02. (G) ITT in mGluR52L/2L:SF1-cre (n = 9) and mGluR52L/2L (n = 8) males. (H) AUC for the ITT in males. (I) Serum levels of insulin in fasted control (n = 11) and mutant (n = 12) females and control (n = 7) and mutant (n = 9) males. *Two-way ANOVA: genotype, P = 0.04; sex, P = 0.02. Bonferroni’s multiple comparisons test: **P = 0.04; ***P = 0.03. (J) Triglyceride (TG) levels in WAT of control and mutant females (n = 6) and control and mutant males (n = 5). *Two-way ANOVA: genotype, P = 0.02; interaction of sex and genotype, P = 0.03. Bonferroni’s multiple comparisons test: **P = 0.01. (K) Adipocyte cell area in mGluR52L/2L:SF1-cre and mGluR52L/2L (n = 5) females. Two-tailed unpaired t test: *P < 0.04. (L) Representative images of WAT in control and mutant females. (M) Serum levels of norepinephrine (NE) in control and mutant females (n = 8) and control (n = 6) and mutant males (n = 5). Two-tailed unpaired t test: *P < 0.01. Data are presented as means ± SEM.

