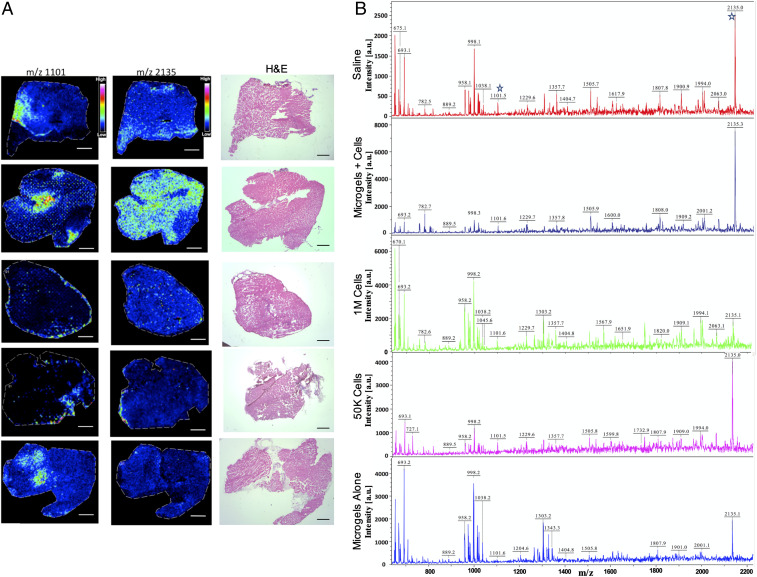
Fig. 9.
In situ profiling of N-linked glycans from tissues. (A) Ion intensity maps of N-glycans showing distribution of m/z 1,101 and m/z 2,135 and consecutive H&E-stained muscle sections. Scale bar, 50 μm. (B) In-solution tissue digest of tissue samples showing ions identified from the MALDI/imaging MS experiments. Ion intensities are normalized to the total ion current for each ion across the tissue, and rainbow scale bars indicate the range of intensities plotted.

