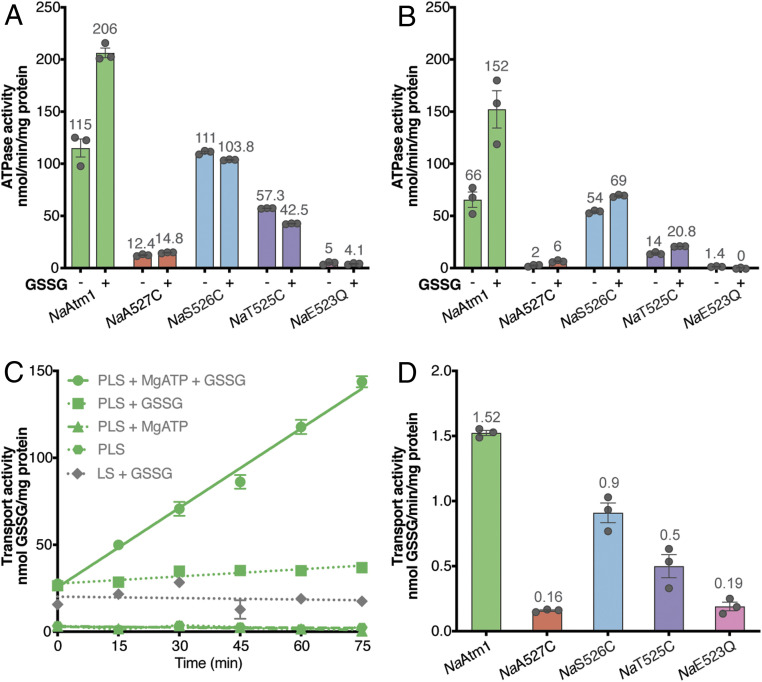
Fig. 2.
NaAtm1 transport and ATPase activities. ATPase activities of wild-type NaAtm1 and variants at 10 mM MgATP in the absence and presence of 2.5 mM GSSG in (A) detergent and (B) PLS. (C) Wild-type NaAtm1 transport activities with various controls at 10 mM MgATP and 2.5 mM GSSG. (D) Transport activities of NaAtm1 and variants with 10 mM MgATP and 2.5 mM GSSG. Error bars represent the SEMs, and circles represent the results of individual measurements. All measurements were done in triplicate. The individual rate measurements for the ATPase and transport activities are presented in SI Appendix, Tables S2 and S3.

