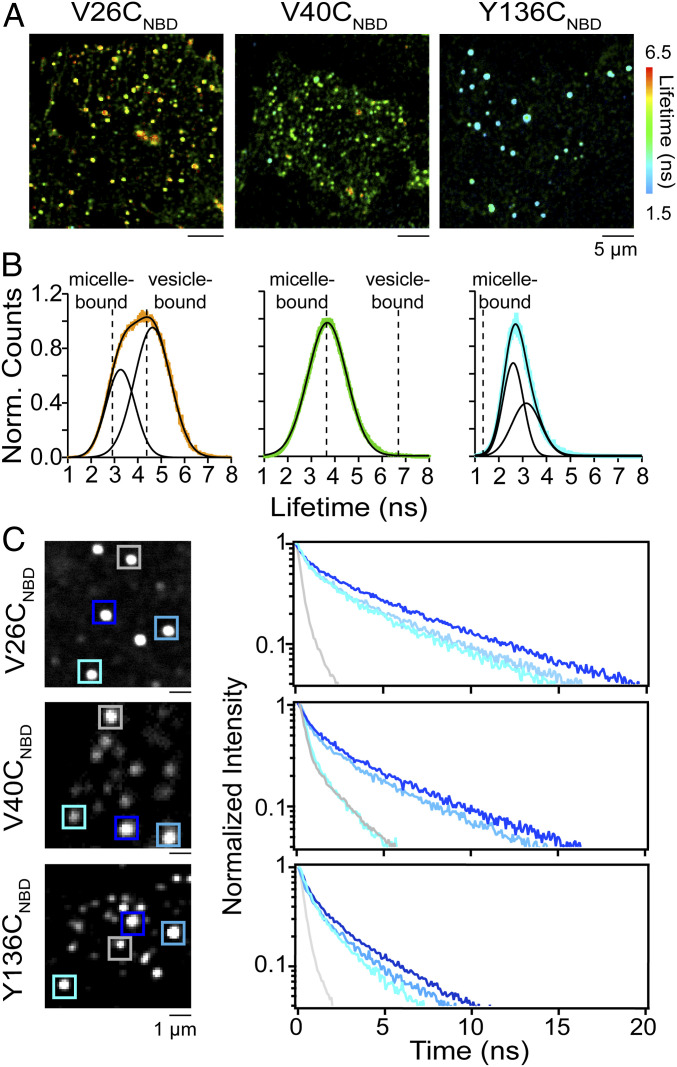
Fig. 4.
Site-specific α-syn conformational heterogeneity on unroofed cells revealed by FLIM. (A) Confocal fluorescence lifetime images of V26CNBD, V40CNBD, and Y136CNBD α-syn on unroofed SK-MEL-28 cells. Red-to-cyan color scale spans lifetimes of 6.5 to 1.5 ns. (B) Fluorescence lifetime distributions of V26CNBD (orange; 14,918 events from n = 46), V40CNBD (green; 11,989 events from n = 30), and Y136CNBD (cyan; 12,823 events from n = 35), where n represent the total number of unroofed cells from two biological replicates. The solid black lines represent Gaussian fits with χ2 values of 0.26 (V26CNBD), 0.17 (V40CNBD), and 0.24 (Y136CNBD). The dashed lines indicate τavg values obtained in the presence of LPC micelles and DOPC/GM1 vesicles. For comparison, single Gaussian fits for V26CNBD and Y136CNBD are shown in SI Appendix, Fig. S15. (C) NBD fluorescence decay kinetics of individual puncta for V26CNBD (Top), V40CNBD (Middle), and Y136CNBD (Bottom). NBD decay kinetics were measured at locations indicated by colored boxes (Left). For fit parameters, see SI Appendix, Table S3. See SI Appendix, Figs. S12–S14 for additional lifetime images, distributions, and decay kinetics.

