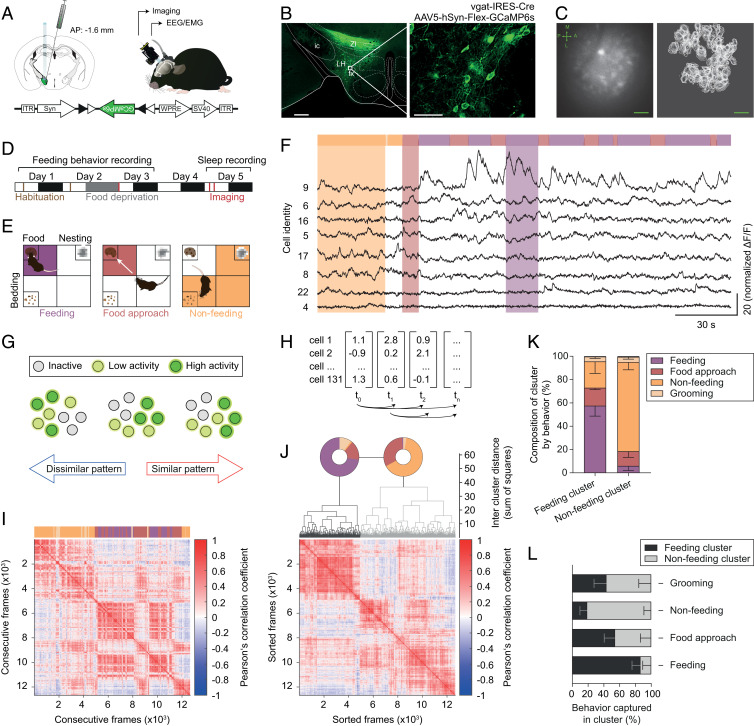
Fig. 1.
Feeding is reliably encoded by LHvgat neurons. (A) Schematic (Left) showing LH injection of Cre-dependent AAV in vgat-IRES-Cre mice. Following cre-dependent local virus transfection, the GCaMP6s cassette is flipped in LHvgat allowing transcription and long-term expression in the LH (Lower). Illustration of the chronic GRIN lens implantation and imaging using a miniature fluorescence microscope in freely moving mice (Right). (B) Photomicrograph of cell-specific expression of GCaMP6s in the LH from vgat-IRES-Cre mice 4 wk after virus injection (Left). Right shows enlargement of the white box highlighted in Left. fx, fornix; ic, internal capsule; LH, lateral hypothalamus; ZI, zona incerta. (C) Representative field of view from imaging of LHvgat neurons with the miniature microscope (Left). Bright cellular structures and dark blood vessels are readily visible. Arrows indicate the body axes (A-P, anterior-posterior; M-L, medial-lateral). Cells were identified using the CNMF-E algorithm (Right). Note that the single cell activity was longitudinally recorded across multiple experimental sessions. (Scale bars, B, Left, 500 µm; B, Right, 50 µm; C, 100 µm.) (D) Experimental timeline. White and dark boxes represent light and dark phase, respectively. (E) An open field arena was divided into four quadrants, which contained either food, bedding, or nesting material or were left empty. Animals were video-tracked and feeding (purple, Left), food-approach (red, Center), and nonfeeding (orange, Right) behaviors were visually scored. (F) Representative recording of calcium transients from GCaMP6-expressing LHvgat cells across feeding behavior (color-coded, Upper) acquired at 10 frames per second. Eight single-cell recordings are shown (black, Lower). (G) Schematic illustration of the concept of neural activity-pattern similarity. Note that the number of neurons (circle) with high (green), intermediate (yellow), or no activity (gray) is the same for all of the three frames displayed, while their activity patterns show high (Right) or low (Left) similarity. (H) Matrix of activity-pattern similarity obtained from cross-correlation of the population vectors at all different time points (i.e., imaging frames) with each other. (I) Representative similarity matrix for a single animal across free-feeding episodes (color-coded bar, Upper). Note the presence of similar activity patterns across consecutive feeding bouts. (J) Hierarchical clustering of data shown in I. The activity patterns grouped into “feeding” (black) and “nonfeeding” (gray) clusters as shown on the dendrogram. The pie charts (Upper) indicate the behavior that was observed when the respective activity patterns occurred. The sorted similarity matrix is shown at the bottom. The clustering is significant, permutation test, P < 0.001. (K) Mean percentage − SEM of LHvgat neuron activity patterns in the cluster associated with a specific behavior. Note the high specificity of the “feeding” and the “nonfeeding” clusters. (n = 5 animals). (L) Mean percentage − SEM of frames in the cluster corresponding to specific behavior out of total frames for this behavior (n = 5 animals). Note the sensitivity of the respective clusters for the different behaviors.

