Fig. 2.
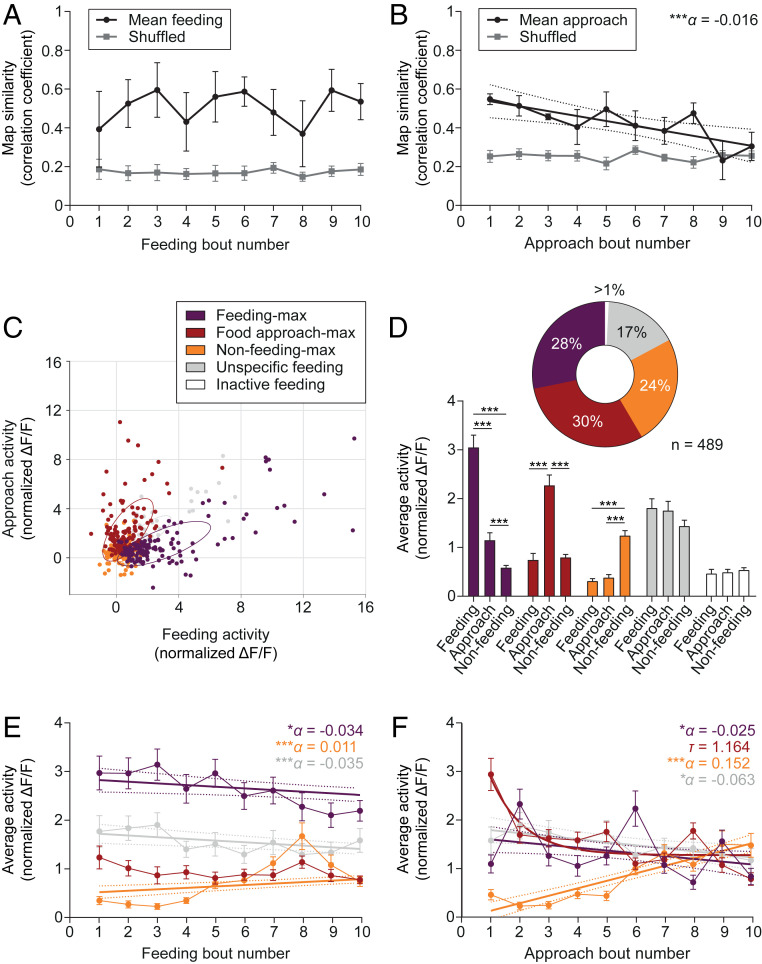
Subpopulations of LHvgat neurons simultaneously carry information about current and prior feeding. (A and B) Mean ± SEM population vector similarity over consecutive feeding (A) or food approach (B) bouts during a recording session (black) as compared to 1,000 randomly drawn samples (Shuffled, gray). Similarity was expressed as correlation with the mean feeding or approach vector. The line in B represents a significant linear regression ± 95% CI with slope α (n = 5 animals). ***P < 0.001. (C) Scatter plot showing the average cell activity (normalized ΔF/F) of each LHvgat cell during feeding and food approach behavior. Neurons were classified according to their activity profiles during different behaviors (Methods Summary). Color coding indicates functional clusters. Ellipses represent the mean-centered covariance of the clusters for feeding and food approach behaviors. Note that the graph was projected to the two axes of largest variance. (D) Mean + SEM cell activity (normalized ΔF/F) of GCaMP6s-expressing LHvgat neurons within the different clusters. The pie chart summarizes the classification (n = 489 cells from 5 animals, Upper). Two-way RM ANOVA, FCluster(4, 484) = 11.70, FCluster x Behavior(8, 968) = 13.76, with Tukey’s post hoc test, ***P < 0.001. (E and F) Mean ± SEM cell activity (normalized ΔF/F) of LHvgat neurons over consecutive feeding E or food approach F bouts by functional cluster (n = 489 cells from 5 animals). Straight lines indicate significant linear regressions ± 95% confidence interval with slope α for different clusters. Note that the activity of food approach-max neurons in F shows a rapid exponential decay with half-life τ. *P < 0.05, ***P < 0.001.

