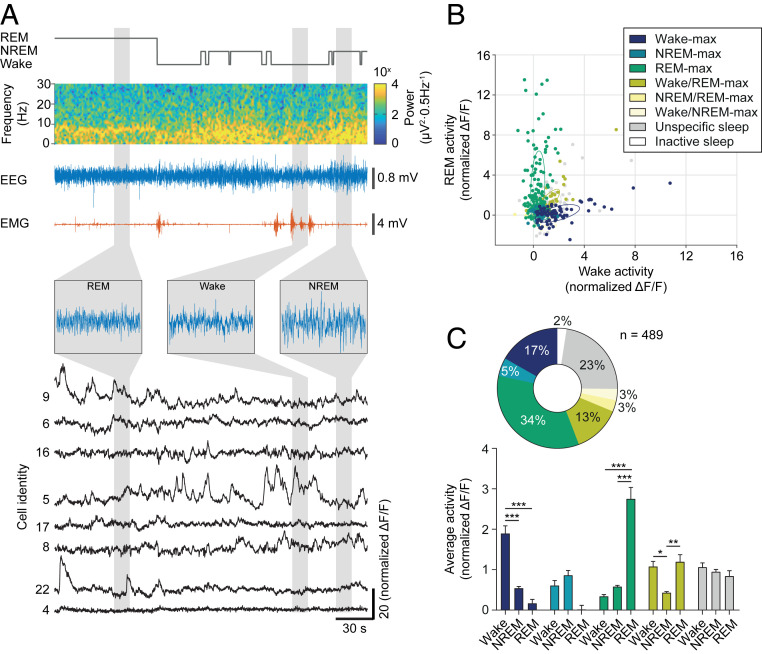
Fig. 3.
LHvgat neurons show high activity during wakefulness and REM sleep. (A) Representative recording of EEG, EMG, and calcium transients from GCaMP6s-expressing LHvgat neurons across sleep–wake states in freely behaving mice. Hypnogram (gray), EEG spectrogram (colormap), EEG (blue), and EMG (red) traces are shown. Insets show extended EEG traces for the different sleep–wake states. Calcium transients for neurons identical to Fig. 1F are displayed (black). (B) Scatter plot shows the average activity (normalized ΔF/F) of each LHvgat cell during wakefulness and REM sleep. Neurons were classified according to their activity profiles during different sleep stages (Methods Summary). Color coding indicates cluster identity. Ellipses represent the mean-centered covariance of the clusters for wakefulness and REM sleep. Note that the graph was projected to the two axes of largest variance. (C) Mean + SEM cell activity (normalized ΔF/F) of GCaMP6-expressing LHvgat neurons within the different clusters encoding sleep and wake states (Lower). The pie chart summarizes the classification of LHvgat neurons (n = 489 cells from 5 animals, Upper). Two-way RM ANOVA, FCluster (4, 440) = 3.97, FState(2, 880) = 5.02, FCluster x State(8, 880) = 37.78, with Tukey’s post hoc test, *P < 0.05, **P < 0.01, ***P < 0.001.

