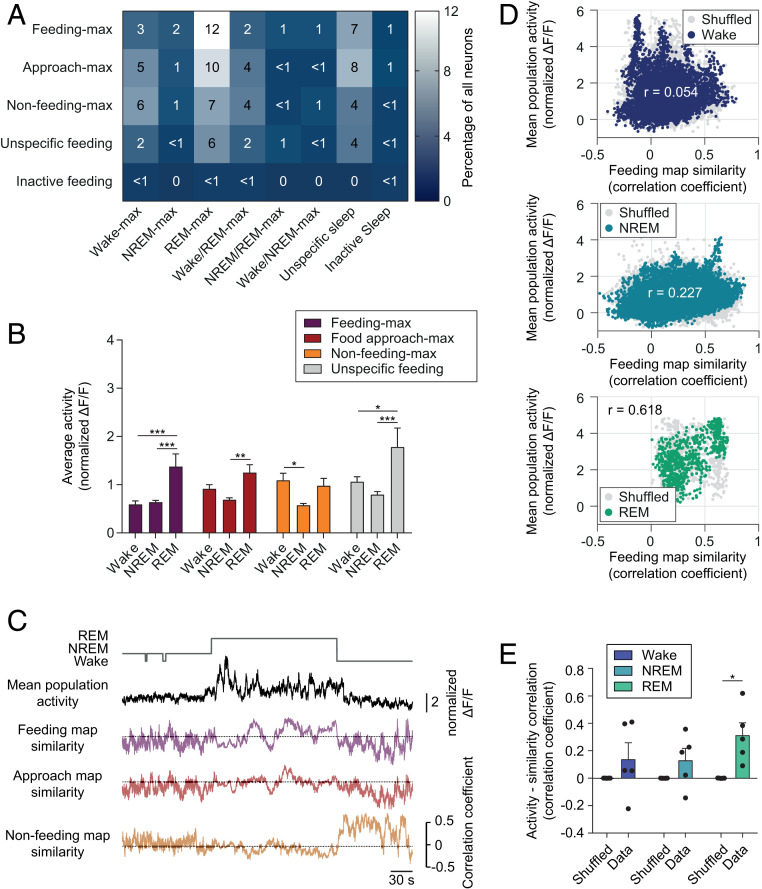
Fig. 4.
Feeding-like population activity patterns are associated with high activity during REM sleep. (A) Coclassification matrix of LHvgat neurons during sleep–wake states and food-directed behaviors. Color coding and numbers represent the percentage of neurons for the corresponding clusters (n = 489 cells from five animals). (B) Mean + SEM cell activity of the functional clusters for feeding behaviors during the different sleep stages. Note the high activation of feeding-max cells during REM sleep, as compared to wakefulness or NREM sleep. Two-way RM ANOVA, FCluster(2, 962) = 20.90, FCluster x State(6, 962) = 2.16, followed by the Tukey’s post hoc test, *P < 0.05, **P < 0.01, ***P < 0.001. (C) Representative traces of overall population activity (black) in comparison to map similarity for feeding behaviors (in respective color) over sleep and wake episodes. (D) Representative scatter plots show the relationship between feeding similarity and population activity during wakefulness (Top), NREM (Middle) and REM sleep (Bottom). Colored dots represent the true data while for gray dots the population activity was shuffled 1,000 times, r indicates the Pearson correlation coefficient for the true data. (E) Mean + SEM feeding similarity – activity correlation for true and shuffled data (n = 5 animals). Two-way RM ANOVA, FShuffle(1, 8) = 17.10, followed by the Sidak’s post hoc test, *P < 0.05.

