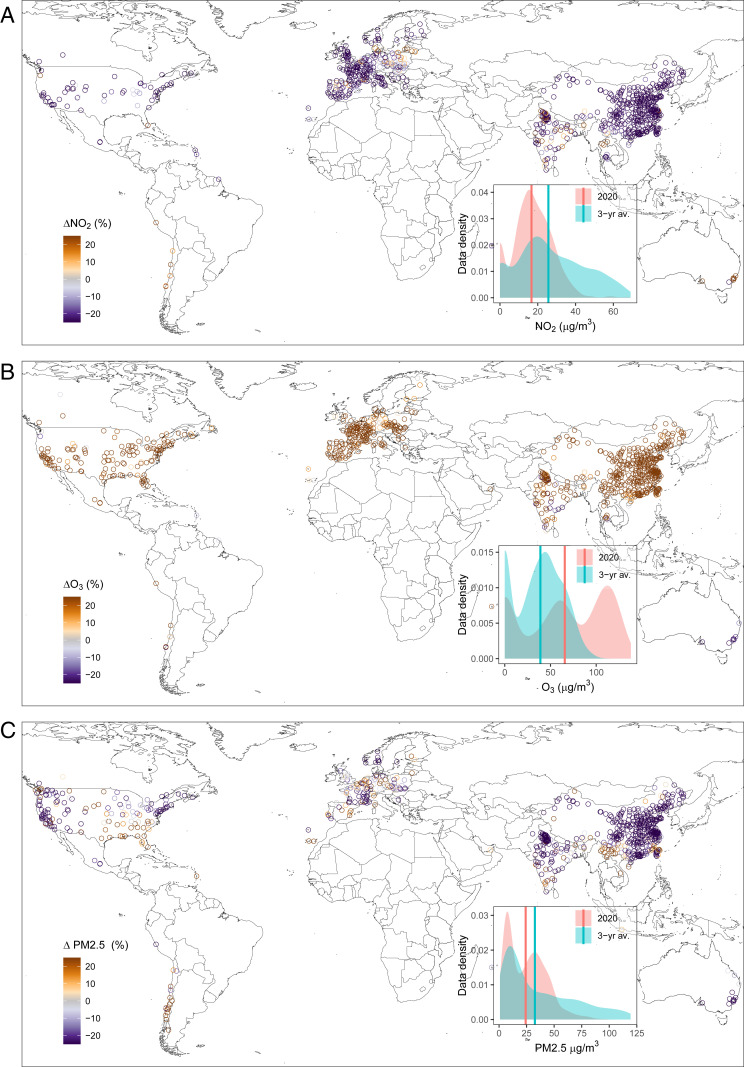
Fig. 1.
Global distribution of 2020 ground-level air pollution anomalies. Ground station measures of NO2 (A), O3 (B), and PM2.5 (C) anomalies are mapped. Anomalies are defined as deviations in 2020 January−May averages from 3-y baseline levels for the same dates and are not corrected for weather variability. Insets show data density distributions for baseline and 2020 periods with median values as vertical lines.

