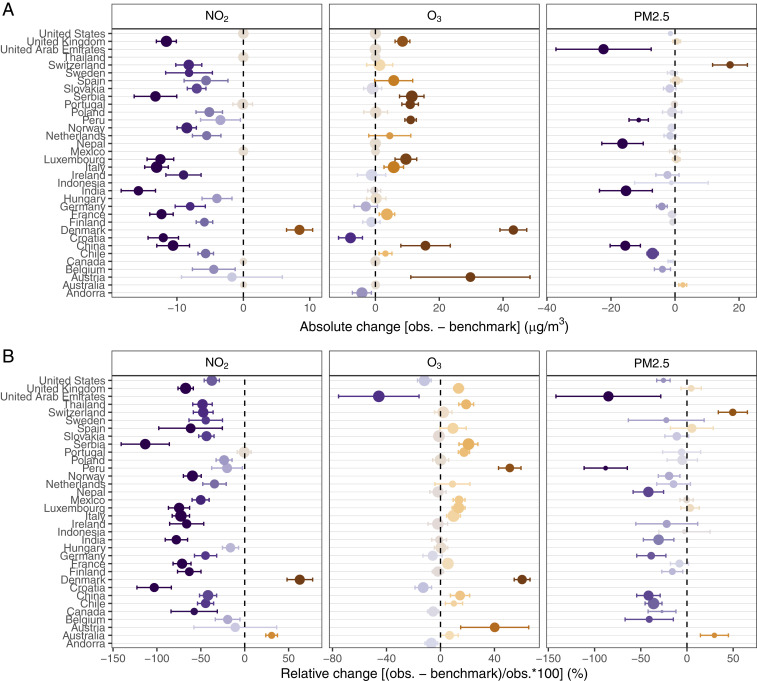
Fig. 3.
Country-specific ground-level lockdown air pollution anomalies. The difference between observed (obs.) lockdown ambient pollutant concentrations and those predicted by the weather benchmark model (trained on 2017–2019 data) are plotted for 34 countries (points) with 95% CIs (error bars). Larger points represent regression models with greater R2 values. Both absolute (A) and relative (B) changes are presented.

