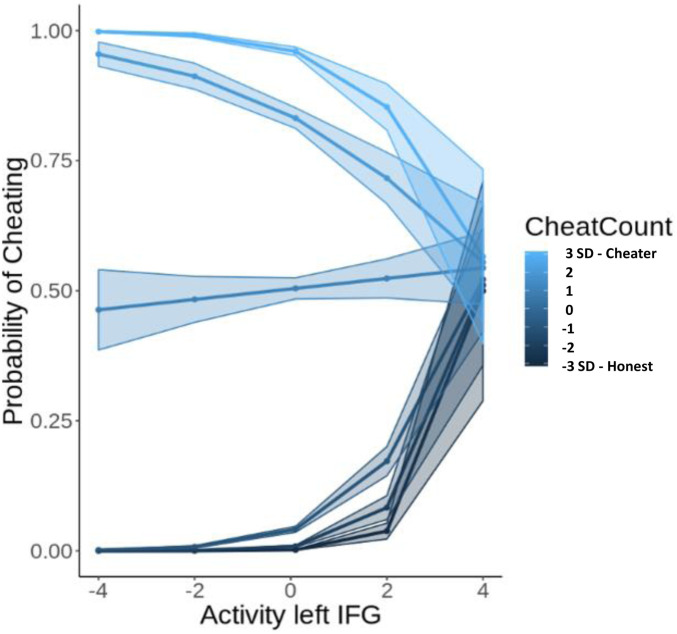
Fig. 5.
Interaction effect between cheat count and the left IFG in predicting the probability of cheating. The lines that are shown are the fitted values for participants 3 SD (lightest blue), 2 SD (light blue), and 1 SD (blue) above the mean of the cheat count and participants 1 SD (dark blue), 2 SD (darker blue), and 3 SD (black) below the mean of the cheat count.

