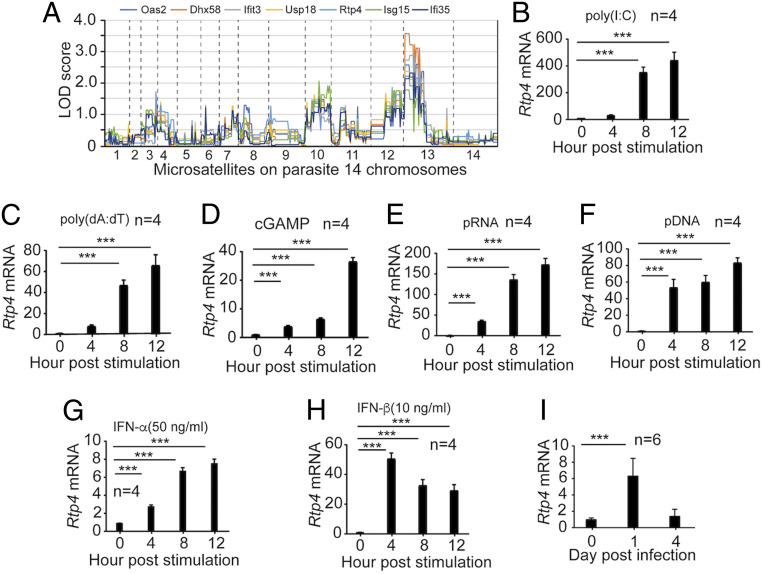
Fig. 1.
RTP4 is induced by IFN-I, ligands of IFN-I response, and malaria parasite infection. (A) Plots of genome-wide pattern of LOD scores. The LOD scores were reported previously (27). The dashed lines indicate the boundaries of the parasite’s 14 chromosomes. (B–F) RTP4 mRNA transcript levels in MEFs (1 × 10⁶) from WT mice after stimulation with various ligands for 4, 8, and 12 h. (B) RTP4 mRNA levels after stimulation with poly(I:C) (1.5 μg) for 4, 8, and 12 h; (C) with poly(dA:dT) (1 μg); (D) with cGAMP (4 μg); (E) with pRNA (5 μg); and (F) with pDNA (5 μg). (G and H) Stimulation of RTP4 expression by IFN-α and IFN-β. MEF cells (1 × 10⁶) were stimulated with IFN-α (G, 100 ng) and IFN-β (H, 20 ng) for 4, 8, and 12 h, respectively. (I) RTP4 transcript levels from the spleens of WT mice p.i. with N67 parasites. Means and SD are from replicates (n) as indicated. One-way ANOVA: ***P < 0.001. All experiments were independently repeated with similar results.

