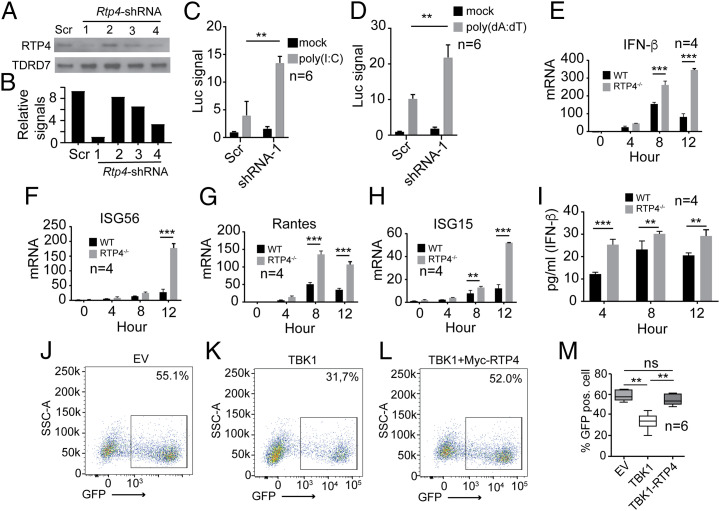
Fig. 3.
Knockdown or knockout of RTP4 increases expression of IFN-β and ISGs. (A) Reduction of RTP4 protein expression after shRNA knockdown (2 μg each shRNA in 2 × 10⁶ 293T cells). Scr, shRNA with scrambled sequence; 1 to 4, four different shRNAs (see Dataset S2 for sequences). A plasmid encoding TDRD7 was used as internal control. (B) Scanned signals from A after subtraction from those of β-actin. (C) Luciferase signals (Luc signal) driven by IFN-β promoter in 2 × 10⁵ 293T cells transfected with RTP4-specific shRNA #1 or Scr shRNA (Mock) after poly(I:C) stimulation (500 ng). (D) Same as in C except stimulation with poly (dA:dT) (125 ng). (E–H) mRNA levels of IFN-β (E), ISG56 (F), Rantes (G), and ISG15 (H) in WT or Rtp4−/− 293T cells at 0, 4, 8, or 12 h after poly(I:C) stimulation (750 ng). mRNA levels were measured using RT-qPCR as described in Materials and Methods. (I) IFN-β protein in culture media in WT or Rtp4−/− 293T cells after poly(I:C) stimulation (750 ng). IFN-β was measured using an ELISA kit (PBL Assay Science). Means and SD from replicates (n) as indicated; two-way ANOVA: **P < 0.01; ***P < 0.001. (J–L) Representative images of flow cytometry counts of green fluorescent (GFP) positive cells infected with vesicular stomatitis virus (VSV). The 293T cells were transfected with empty EV, vector containing TBK1 gene (100 ng), or TBK1 vector plus vector containing myc-RTP4 gene (200 ng). After 24 h, the cells were infected with VSV-eGFP (MOI = 0.001) for 16 h and counted using flow cytometry. (M) Plot of percentages of GFP-positive cells. Mann–Whitney test (n = 6), mean + SD; **P < 0.01.

